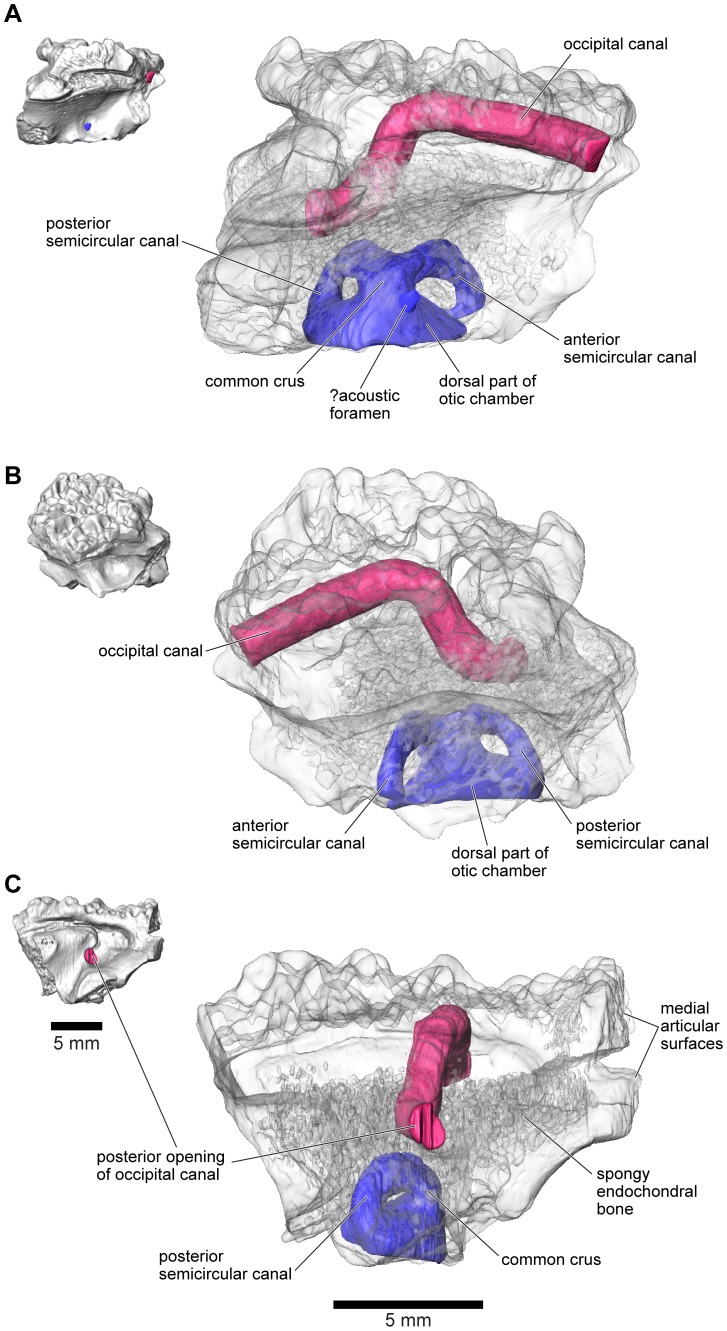
Figure 28. Internal morphology of left frontoparietal and otoccipital, UA 9675.
A, medial; B, dorsolateral; and C, posterior views of digital segmentation of μCT dataset. Small opaque images at left for orientation; larger semi-transparent images at right, including occipital canal rendered in red and inner ear structures in blue.

