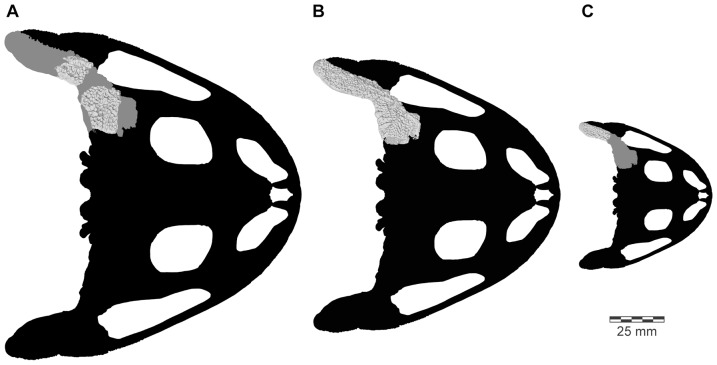
Figure 47. Intraspecific size range of Beelzebufo ampinga.
Left squamosals of A, UA 9629; B, FMNH PR 2512 (reversed for comparison); and C, UA 9614, all in dorsal view. Skull silhouettes based on Fig. 4B and scaled by variation in size range of selected squamosals. Assuming isometric growth trajectory, individual represented by UA 9629 would have been about 20 percent larger than FMNH PR 2512, and that represented by UA 9614 about half the size of FMNH PR 2512.

