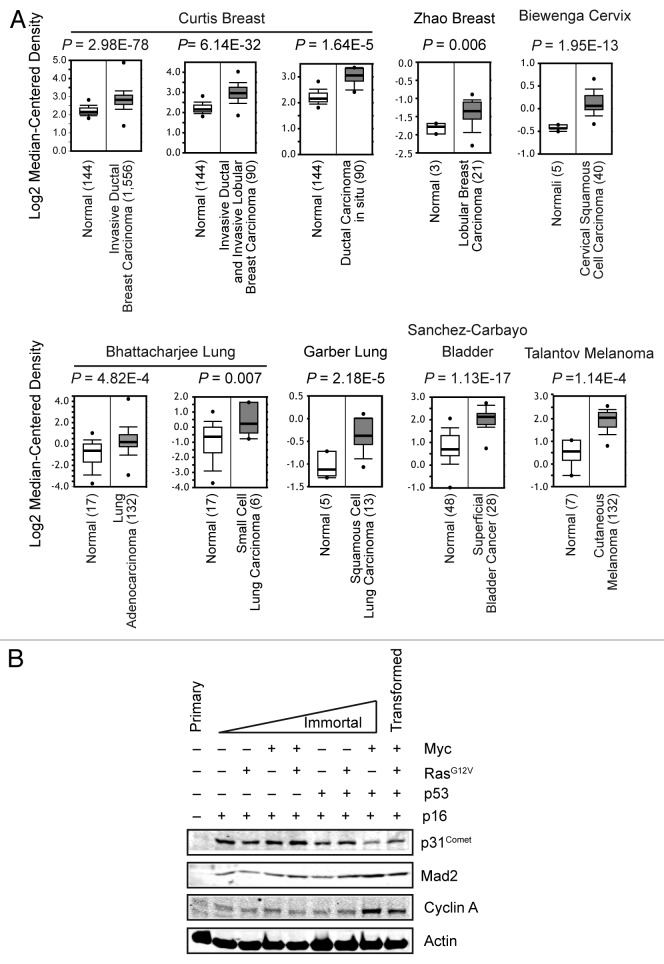
Figure 1. Expression levels of p31Comet increase in cancer. (A) Comparison of p31Comet mRNA expression differences between normal and tumor samples for multiple tissues. The mean expression for each sample group is represented. The number of samples in each group are indicated in parentheses. Data were obtained from the Oncomine database. (B) p31Comet protein levels increase during the immortalization/transformation of HMECs. Cell lysates of primary HMECs and derivatives expressing the indicated shRNAs or oncogenes were probed for the indicated proteins by immunblot analysis.

An official website of the United States government
Here's how you know
Official websites use .gov
A
.gov website belongs to an official
government organization in the United States.
Secure .gov websites use HTTPS
A lock (
) or https:// means you've safely
connected to the .gov website. Share sensitive
information only on official, secure websites.
