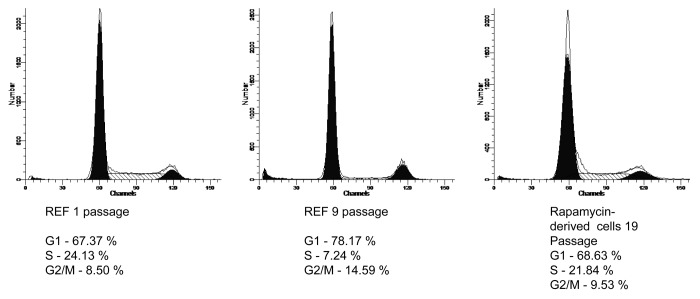
Figure 2. Flow cytometric analysis of cell cycle distribution of senescent REFs (passages 1 and 9 and REF cells treated by rapamycin (passage 19). Cells at different passages of culturing were prepared as described in the section “Flow cytometry” and analyzed for G1, S, and G2 phase ratio. (A) REF, passage 1 without rapamycin; (B) REF, passage 9 without rapamycin; (C) Rapamycin-derived cells, passage 19 (rapamycin treatment of REFs during passages from 7–10).

An official website of the United States government
Here's how you know
Official websites use .gov
A
.gov website belongs to an official
government organization in the United States.
Secure .gov websites use HTTPS
A lock (
) or https:// means you've safely
connected to the .gov website. Share sensitive
information only on official, secure websites.
