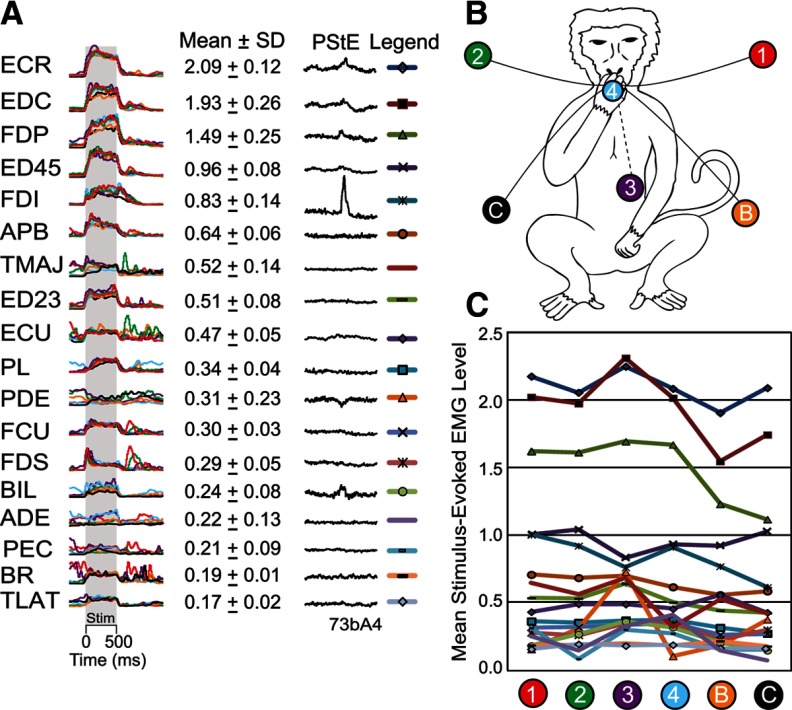
Figure 4.
A, HFLD-ICMS elicited EMG activation patterns associated with six starting hand positions at a layer V site and corresponding poststimulus effects (PStE) elicited with 15 Hz stimulation at 30 μA. Stimulation at this cortical site drove the hand to an end-point near the location marked by the black circle C (B) of this figure. Traces are color coded for starting hand position. Gray shading represents a 500 ms stimulus train (100 pulses at 120 μA). Evoked EMG activity for the same muscle is displayed at the same gain. B, Numbered and lettered circles represent the starting hand positions within the monkey's workspace. C, Mean stimulus-evoked EMG activation levels at each starting hand position. EMG activity is in arbitrary units.

