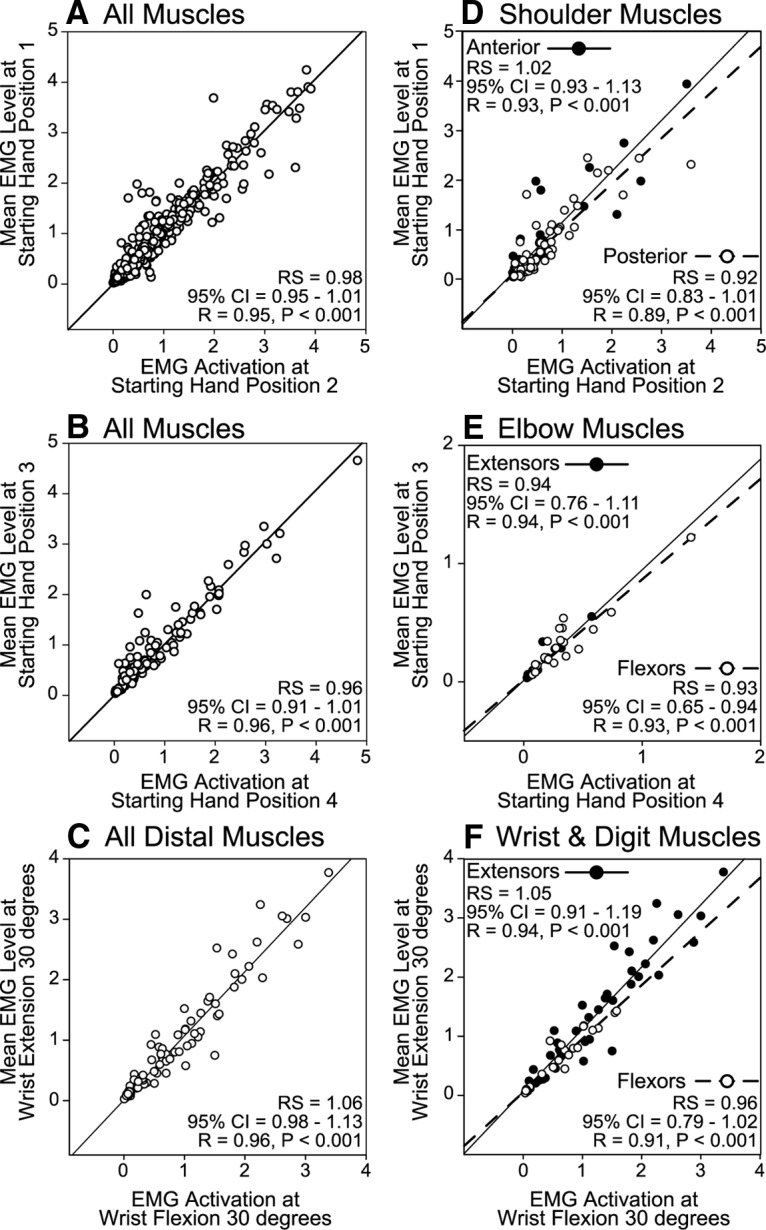
Figure 6.

A–C, Relationship between the magnitudes of HFLD-ICMS-evoked EMG activity at starting hand positions that produced the most extreme positions of the shoulder (A), elbow (B), and wrist (C). Linear regression lines are plotted, 95% confidence intervals (CI) for the regression slopes (RS), correlation coefficients (R) and P values are given. EMG activity is in arbitrary units. Starting hand positions relate to Figure 1. D–F, The muscles are separated by joint and stability of magnitude is tested for the starting hand positions that produce the largest changes in angle for the muscles acting at that joint. Agonist and antagonist muscles are plotted separately. Each data point represents a cortical site-muscle pairs for all cases in which the starting hand positions indicated were tested.
