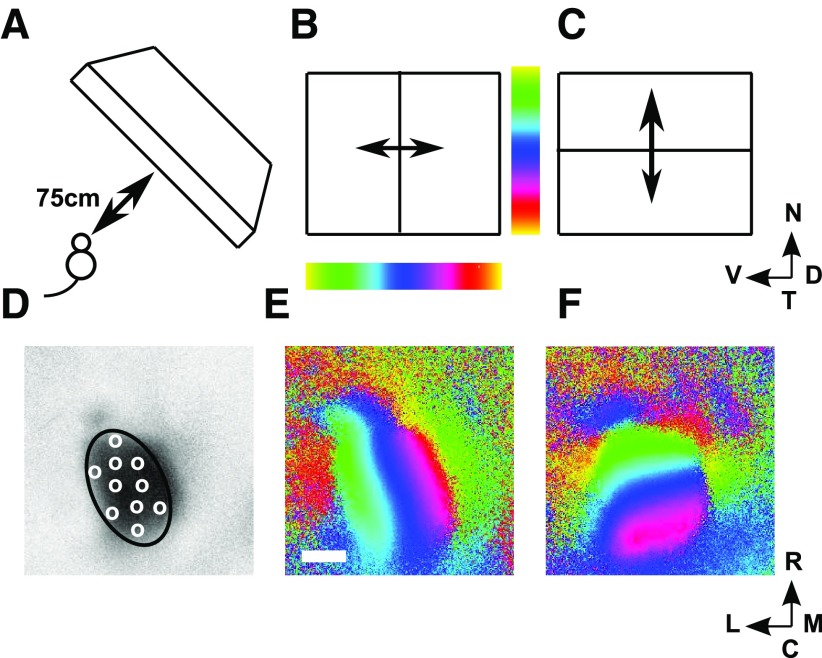
Figure 1.
The Fourier-based intrinsic imaging method. A, The positioning of the scanning monitor, which covers nasal field. B, C, The elevational (B) and azimuthal (C) scans. D, The region defining the extent of the colliculus (ROI) drawn on a plot of the activity profile for the elevational scan, with illustrative pseudo-randomly positioned nodes shown as white circles. E, WT map. Each of the 62,500 pixels making up the brain area scanned is colored to indicate the position along the dorsoventral axis that yields maximal excitation in the elevational scan (B). Scale bar, 500 μm; color bar shown in B. F, The same pixels are colored according to the position along the nasotemporal axis that yields maximal excitation in the azimuthal scan (D), with the color bar shown in C. Visual field: N, nasal; T, temporal; D, dorsal; V, ventral. Directions on the colliculus: R, rostral; C, caudal; M, medial; L, lateral. B–F are oriented as in Cang et al. (2008) (their Fig. 1) from which this figure is redrawn.

