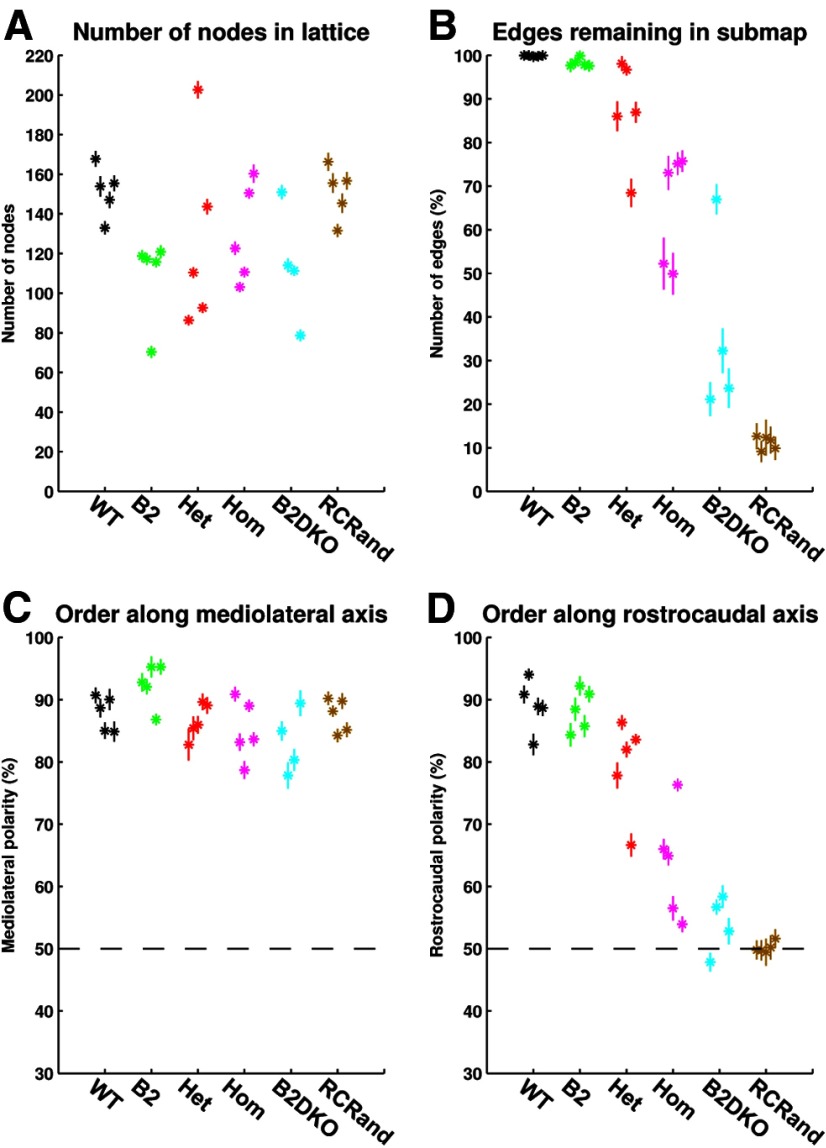
Figure 11.
Variation in the key properties of the map over 20 different placements of the nodes forming the map, for each of the 29 different sets of analysis. A, Number of nodes in the lattice. B, Local order: percentage number of edges in the full map that are retained in the largest ordered submap. C, Global order: polarity measured along the mediolateral axis. The dotted line indicates the 50% level, corresponding to no order. D, Global order: polarity measured along the rostrocaudal axis. The dotted line indicates the 50% level, corresponding to no order. In all figures, data for each of the 29 cases are plotted separately. Means and SDs are shown. Black represents WT; green, β2; red, HetTKO; magenta, HomTKO; cyan, β2DKO; brown, RCrand.

