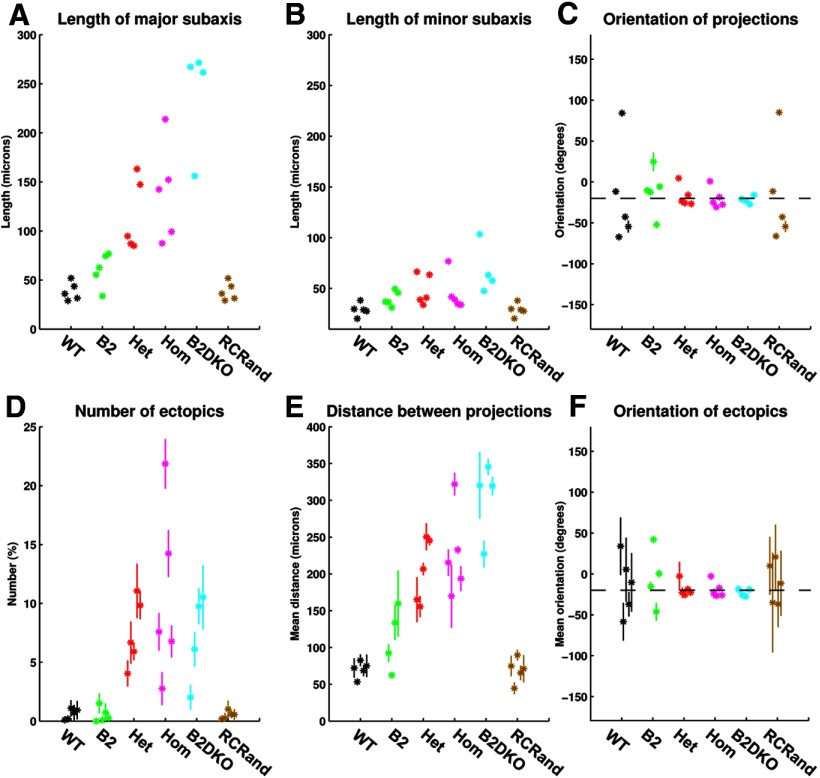
Figure 13.
Variation in the properties of the projection from small areas of visual field onto colliculus taken over 20 different placements of the nodes forming the map, for each of the 29 different sets of analysis. A, Length of the major subaxis of the ellipse characterizing the superposed projection fields (from small circular areas of field onto the colliculus). B, Length of the minor subaxis of the ellipse characterizing the superposed projection fields. C, Orientation of the major axis of the ellipse with reference to the rostrocaudal axis. The dotted line indicates an orientation of −20°, running from rostrolateral to caudomedial. D, Number of ectopic projections. E, Distance between the two termination sites involved in the ectopic projection. F, Orientation of the line joining the two termination sites forming the ectopic projection. The dotted line indicates an orientation of −20°. In all figures, data for each of the 29 cases are plotted separately. Means and SDs calculated over the 20 runs are shown. Most large SDs derive from data with very small numbers of ectopics. Color key as in Figure 11.

