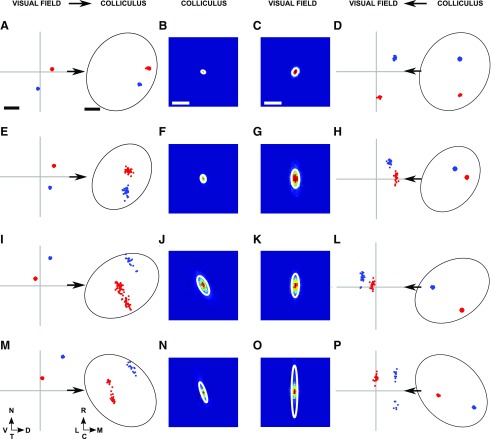
Figure 3.
Examples of visual and projection fields, after initial filtering. Data from the four primary groups of data are illustrated, the groups being defined at the beginning of Results. A, WT dataset. Two examples, distinguished by color, of individual projection fields. B, Superposition of all the projection fields from all the nodes in the visual field for that dataset. C, Similar to B but showing the superposition of all the receptive fields from the nodes defined on the colliculus, individual examples being shown in D. D, Similar to A but showing two examples of receptive fields. E–H, Similar distributions taken from a β2 knock-out dataset. I–L, Similar distributions taken from a HetTKO dataset. M–P, Similar distributions taken from a HomTKO dataset. Scale bar, 250 μm (colliculus). Calibration: 20° (visual field). Other conventions as in Figure 2.

