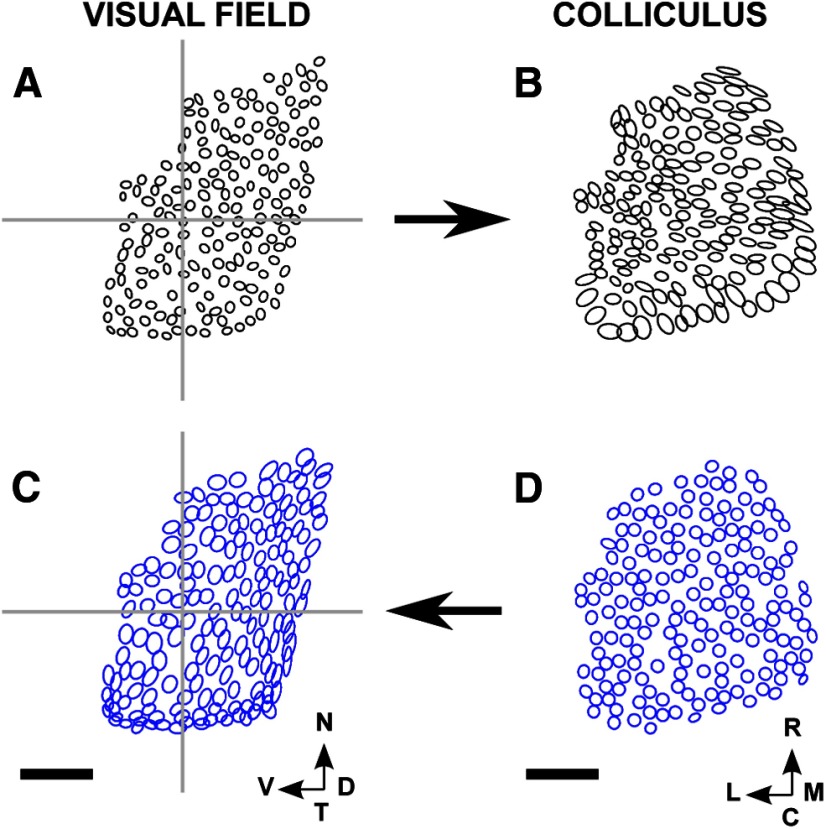
Figure 5.
Projections of small circular areas of visual field on the colliculus, and vice versa, for a WT dataset. A, B, Map of visual field onto colliculus (F → C map). A, Ellipses fitted to the eligible points within the circles of radius 1.7°, each drawn around a node. B, Ellipses fitted to the projection fields. C, D, Similar plots for the map of colliculus into visual field (C → F map). D, Ellipses fitted to the eligible pixels within the circles of radius ∼27 μm, each drawn around a node on the colliculus. C, Ellipses fitted to the receptive fields. In all four plots, the lengths of the major and minor subaxes of the ellipses are equal to the SDs of the appropriate distributions as measured along these axes. Number of nodes: 175. Scale bar, 250 μm (colliculus). Calibration: 20° (visual field). Other conventions as in Figure 2.

