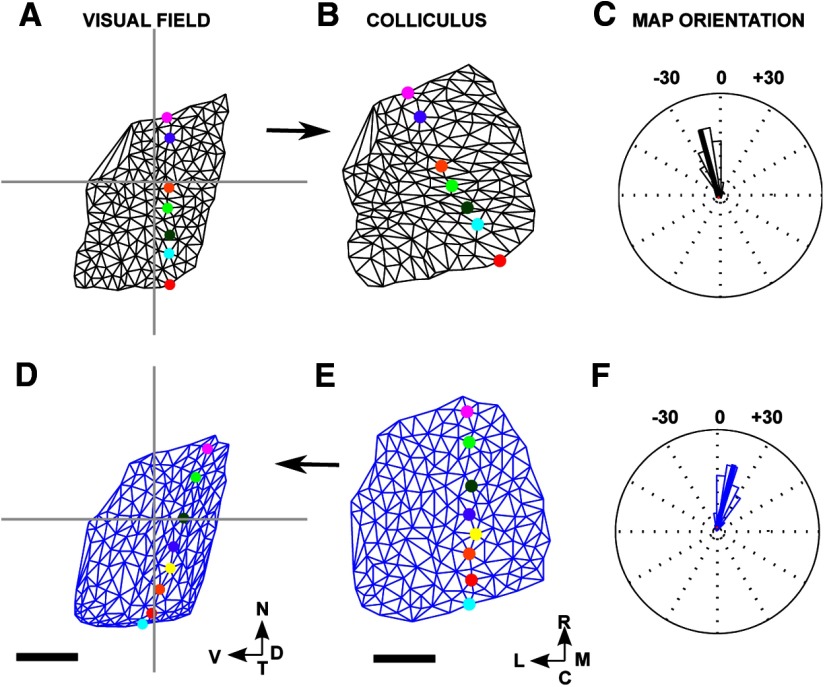
Figure 6.
F → C and C → F maps for the WT dataset used for Figure 5. Lattices and networks were constructed as illustrated in Figure 4. A, Lattice of the selected nodes constructed in the visual field, with the nasotemporal direction indicated by a set of colored nodes. B, The map constructed on the colliculus. C, The circular histogram of the orientation of each edge in the map, with the mean orientation indicated by a black line. Units are degrees. This distribution of orientations was found by comparing the relative orientation of each edge in the lattice in A with that of the corresponding edge in B. The mean orientation of −15° corresponds approximately to the difference in orientation between the two lines of colored nodes in A and B. D, E, The map in the visual field (D) as projected from the lattice constructed in the colliculus (E). F, Circular histogram of the map defined in D and E. In neither the F → C map (A, B) nor the C → F map (D, E), do any edges cross over. Number of nodes: 175. Scale bar, 250 μm (colliculus). Calibration: 20° (visual field). Other conventions as in Figure 2.

