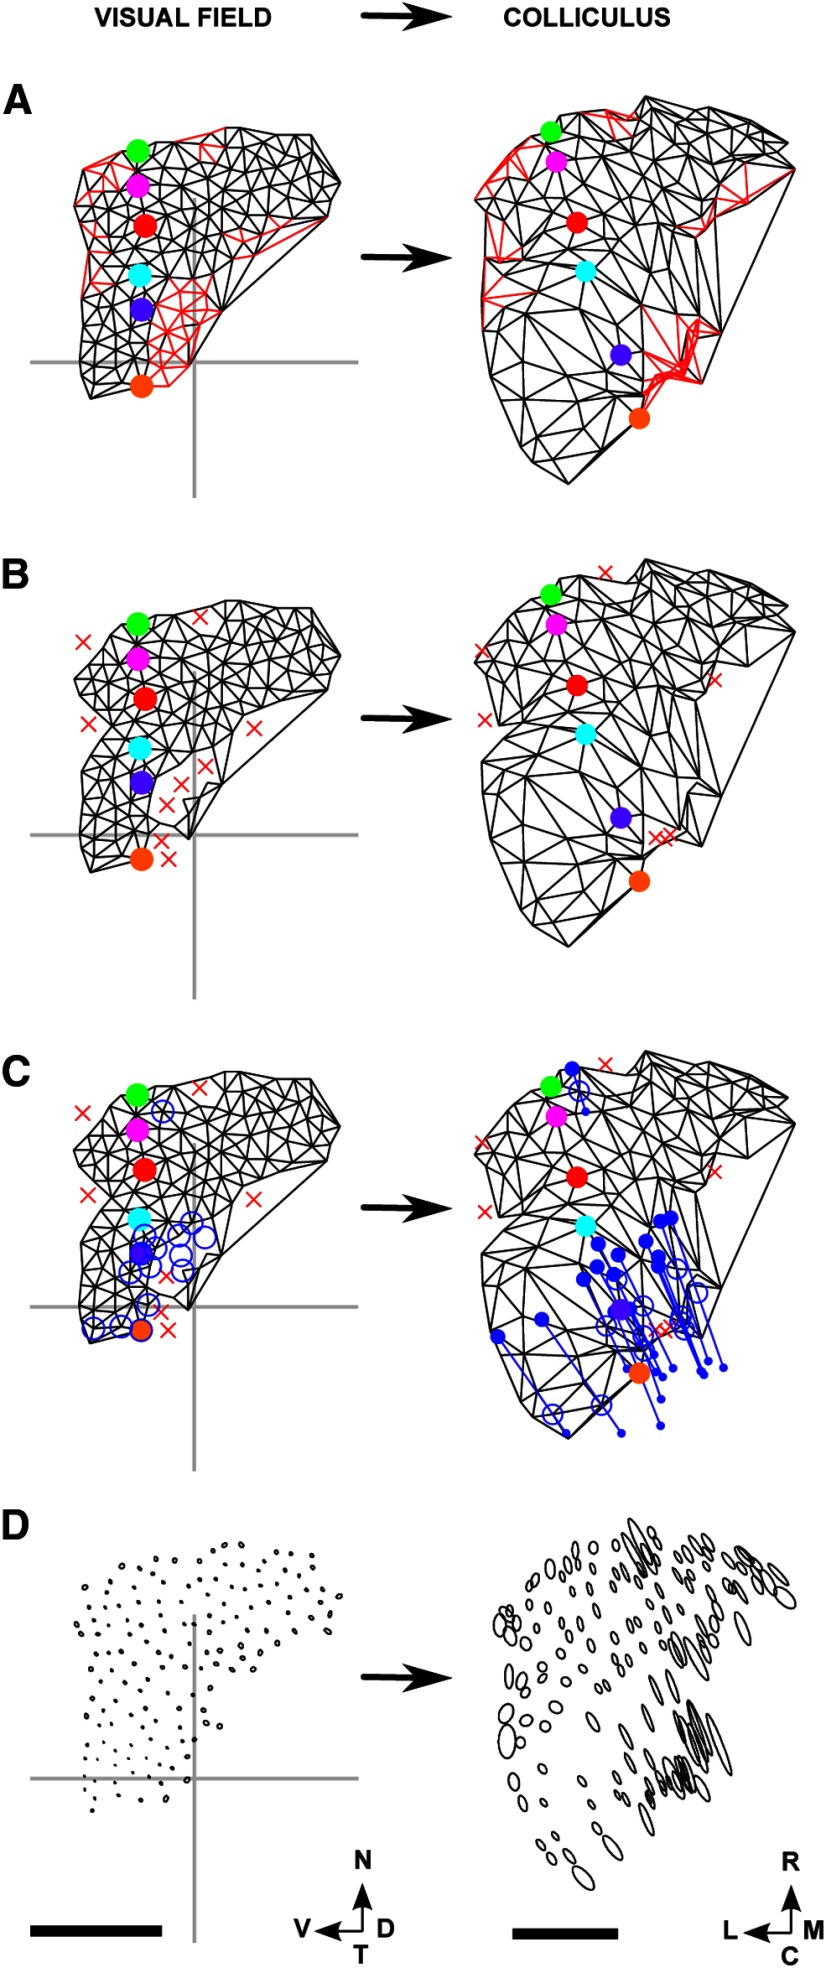
Figure 8.
F → C maps for a heterozygous ephrinA knock-out (HetTKO) dataset. A, Lattice constructed on the nodes in the field (left) and the corresponding map on the colliculus (right). B, Lattice drawn on the nodes involved in the largest ordered submap together with the map on the colliculus, with nodes not involved indicated by a red cross. C, A copy of B to which information about ectopic projections was added. In the visual field plot, the nodes involved in ectopic projections are indicated by blue unfilled circles and are located in central field. In the colliculus plot, the positions of the major and minor projections, mainly located caudomedially, are shown as large and small filled blue circles, and the average positions by unfilled blue circles. Corresponding major and minor projections are connected by a straight line. D, Projections of small areas of visual field on the colliculus. Each area is represented as an ellipse with the lengths of the major and minor subaxes being the SEM of the appropriate projection field as measured along these axes. Number of nodes: 175. Scale bar: 250 μm (colliculus). Calibration: 20° (visual field). Other conventions as in Figure 2.

