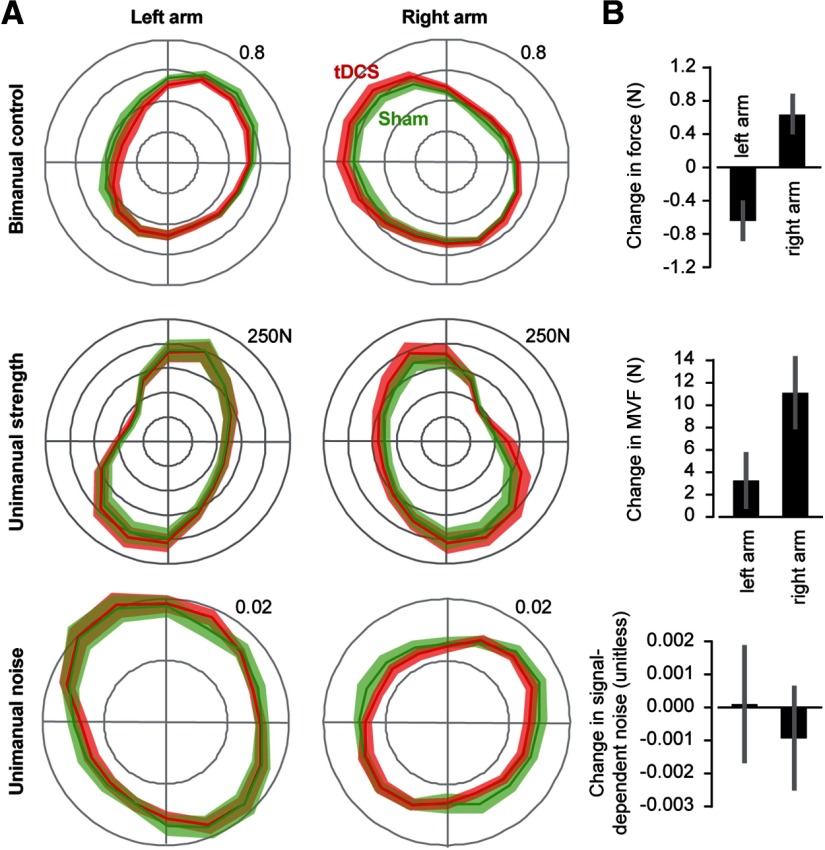
Figure 7.
Effect of tDCS on bimanual control, unimanual strength, and noise of a group of RH young people. A, Top row, The force produced by each arm during bimanual control, represented as the fraction of total force produced by both arms. Middle row, MVF of each arm. Bottom row, Signal-dependent noise. B, Top row, tDCS-induced change in force produced by each arm during bimanual control, averaged over all directions. Middle row, tDCS-induced change in MVF of each arm, averaged over all directions. Bottom row, tDCS-induced change in signal-dependent noise in each arm, averaged over all directions. Data are mean ± SEM.

