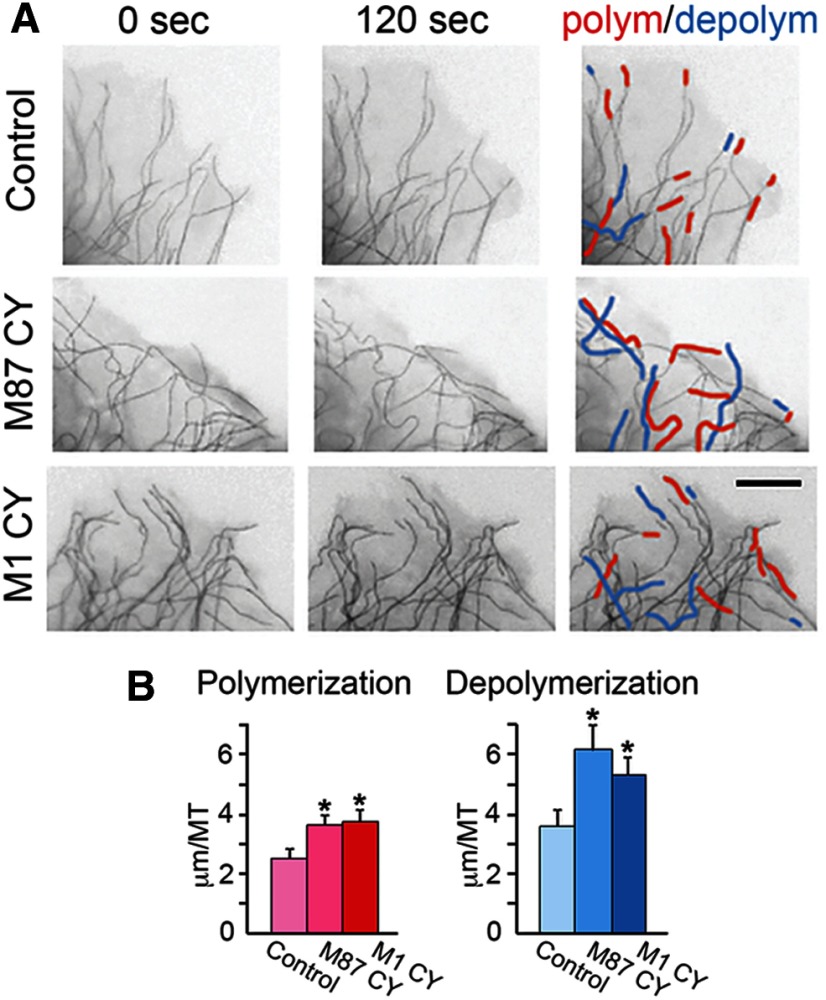
Figure 10.
Expression of mutated spastin isoforms affects the length of growth (polymerization) and shortening (depolymerization) of individual MTs in live cells. RFL-6 cells were cotransfected with M87 C448Y or M1 C448Y cDNA cloned into a bicistronic pIRES2 DsRed-Express2 vector and with the tdEos-tubulin-C-18. Fluorescent microscopic images of MTs in live cells were subjected to the “invert” function in AdobePhotoshop to improve contrast. A, The expression of M87 C448Y or aggregated M1 C448 resulted in increased growth (red tracings) and shortening (blue tracings) of individual MTs over 120 s, compared with nonexpressing controls. B, Quantification revealed statistically significant increase in polymerization and depolymerization of MTs in cells expressing M87 C448Y or aggregated M1 C448Y. Values are mean ± SEM. Scale bar, 5 μm.

