Figure 2.
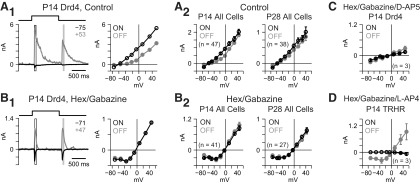
Light-evoked responses are dominated by inhibition. A1, A P14 Drd4 ganglion cell response to 1 s of UV light (365 nm, 2 mm diameter). Here and elsewhere, synaptic currents are shown at the two indicated Vholds (in mV; left) and current responses averaged within the white (light-ON) and gray (light-OFF) rectangles are plotted versus Vhold (right). I–V plots were linear and reversed near ECl (−67 mV). A2, Averaged I–V plots for ON and OFF responses for a combined population of Drd4 and TRHR cells at P14 and P28. Error bars indicate ±SEM. B1, Same format as A1 in the presence of hexamethonium (100 μm) and gabazine (20 μm). I–V plot was J-shaped and reversed near Ecation (0 mV). B2, Population averages for the response in B1. C, Population averages when D-AP5 (100 μm) was added to hexamethonium and gabazine, blocking the J-shaped I–V relationship. D, Population averages when L-AP4 (50 μm) was added to hexamethonium and gabazine, blocking the ON response selectively.

