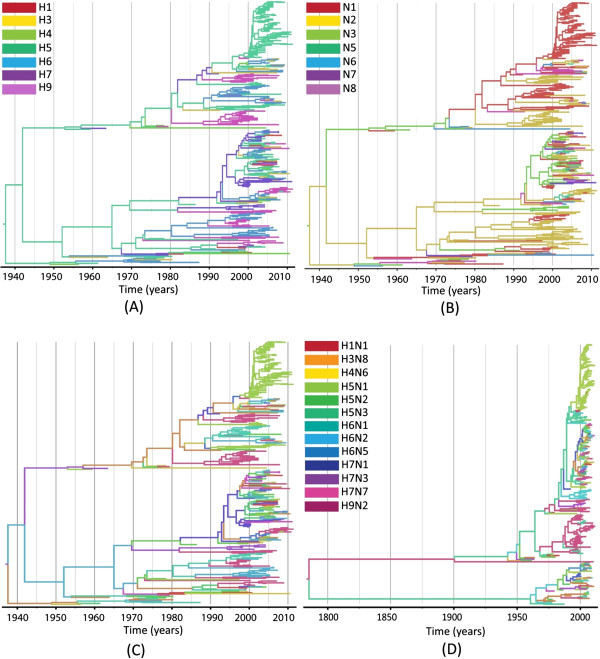
Figure 1.
Bayesian maximum clade credibility phylogenies for the internal segments encoding PB2 and NS. A: PB2 phylogeny, colored by HA subtype. B: PB2 phylogeny colored by NA subtype. C: PB2 phylogeny colored by combined HA-NA subtype. D: NS phylogeny colored by combined HA-NA subtype. Branches are colored according to the different subtypes of their descendent nodes (C and D share the same key). The full tree with all taxon names is given in Additional file 1: Figure S2.

