Fig. 3.

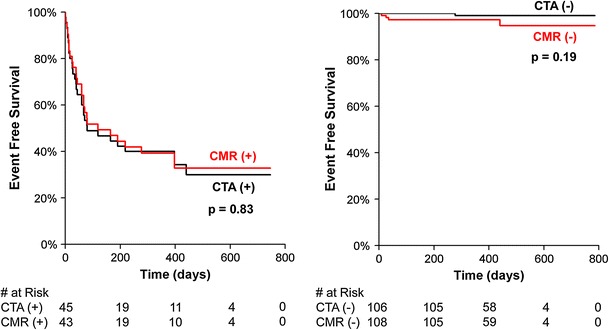
Kaplan–Meier curves for the comparison of abnormal and normal results of CMR and CTA findings. Differences between curves are statistically not significant (p = 0.83 and 0.19 by log-rank test, respectively)

Kaplan–Meier curves for the comparison of abnormal and normal results of CMR and CTA findings. Differences between curves are statistically not significant (p = 0.83 and 0.19 by log-rank test, respectively)