
Table 2.
Comparison of the prognostic impact of the different CpGs tested
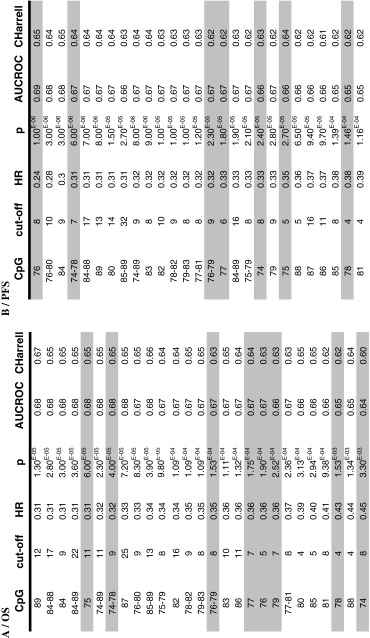
For each of the 16 CpG sites and mean of selected CpG sites, one optimal risk cut-off was determined according to the outcome of patients (A/overall survival (OS), B/progression free survival (PFS)). These cut-offs were used to determine the associated hazard ratio (HR) and the level of significance (represented by the p value, which is to compare to 1.3/1,000 with the multiple comparison correction of Bonferroni), after adjustment on age and Karnofsky score. The prediction errors were globally evaluated and reported as the Area Under the ROC Curve (AUCROC) and the Harrell’s C index. Results are classified according to the HR and from the lowest to the highest p value. The CpGs tested with the Qiagen kits appear on a grey background