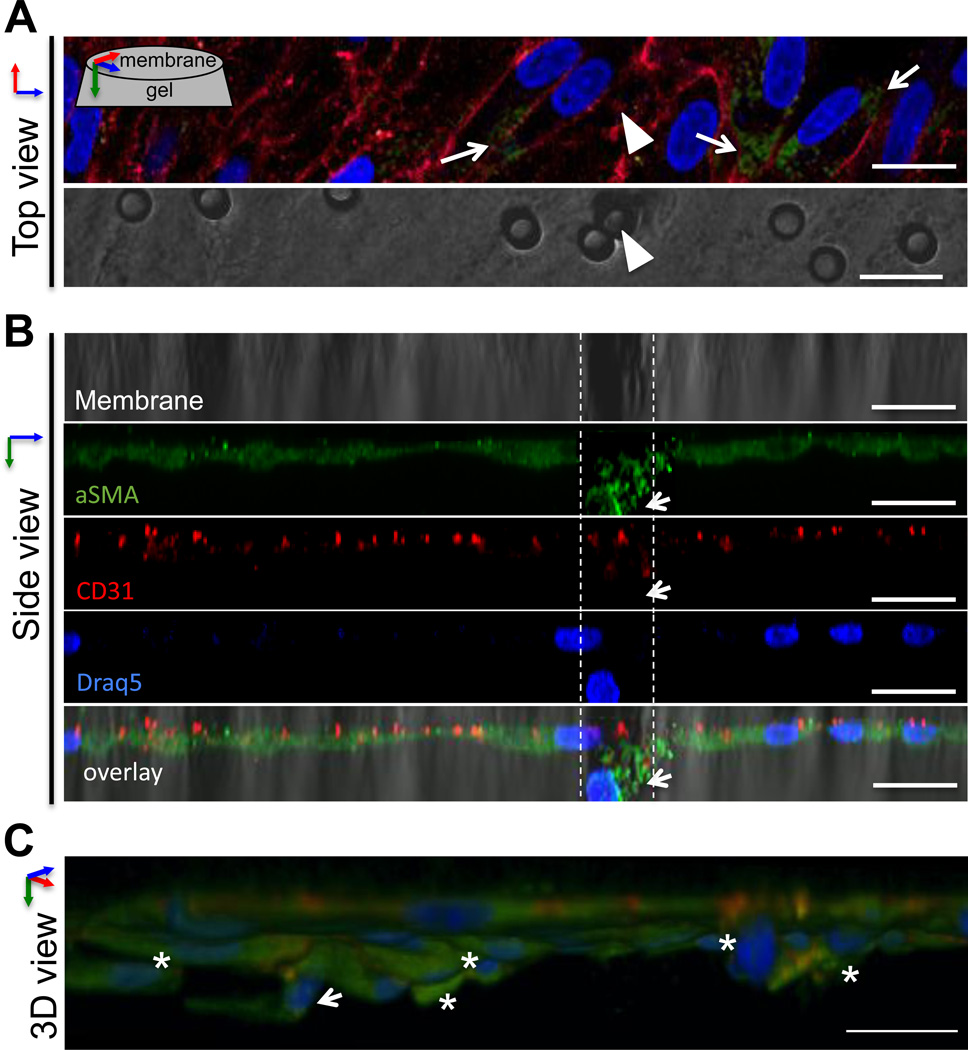
Figure 3.
Imaging of TNFα-EndMT process. A. Top view. After 48 hours of TNFα treatment, a subset of VEC have increased αSMA expression (arrows). In this image, a single VEC has begun to pass through a pore in the membrane (arrowhead). Lower panel shows 3µm membrane, arrowhead indicates the pore associated with the invading VEC. B. Side view of same cell field. Reconstruction of a high-resolution image stack of the same cell field as in A shows invasion of VEC through the pore (dashed lines). The migrating VEC has reduced CD31 and increased αSMA (arrow). C. Three-dimensional reconstruction of the same cell field as in A, B shows the same invading VEC (arrow), as well as other VEC in the same region invading through the membrane into the hydrogel (asterisks). The invading cells have increased αSMA and express CD31. Scale bar is 20µm.

