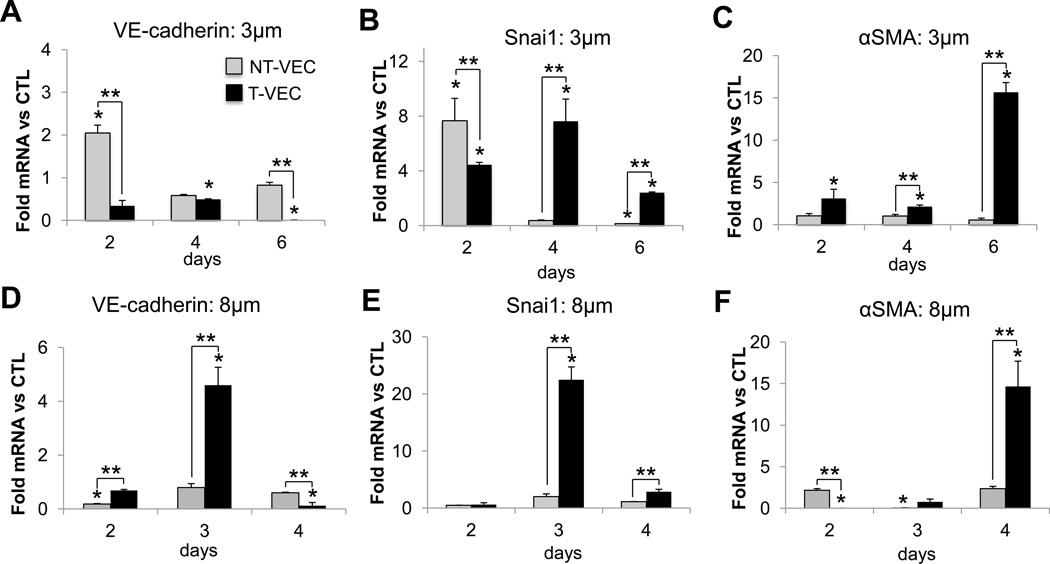
Figure 4.
Time-dependent expression of EndMT genes in VEC treated with TNFα. A–C, 3µm pore membrane. A. VE-cadherin expression was initially increased in NT-VEC and returned to control levels at day four and six. VE-cadherin decreased in the T-VEC population over time. B. Snai1 expression was elevated initially in both VEC populations. At day four, Snai1 decreased in NT-VEC to less than control and remained elevated in T-VEC until day six. C. αSMA expression was low in NT-VEC and increased in T-VEC. D–F, 8µm pore membrane. D. VE-cadherin expression was decreased in VEC remaining on membrane. Transformed VEC had elevated VE-cadherin expression on day three of treatment that is decreased by day four. E. Transformed VEC had elevated Snai1 expression after three days of treatment. F. Transformed VEC had highly elevated αSMA expression after four days of TNFα treatment. VEC remaining on membrane maintained αSMA levels similar to control (> 37 cycles). All experiments performed with n > 3. Errors bars indicate SEM. * indicates p < 0.05 versus control VEC at same time point; ** indicates p < 0.05 versus indicated group, according to ANOVA followed by Student’s t-test.

