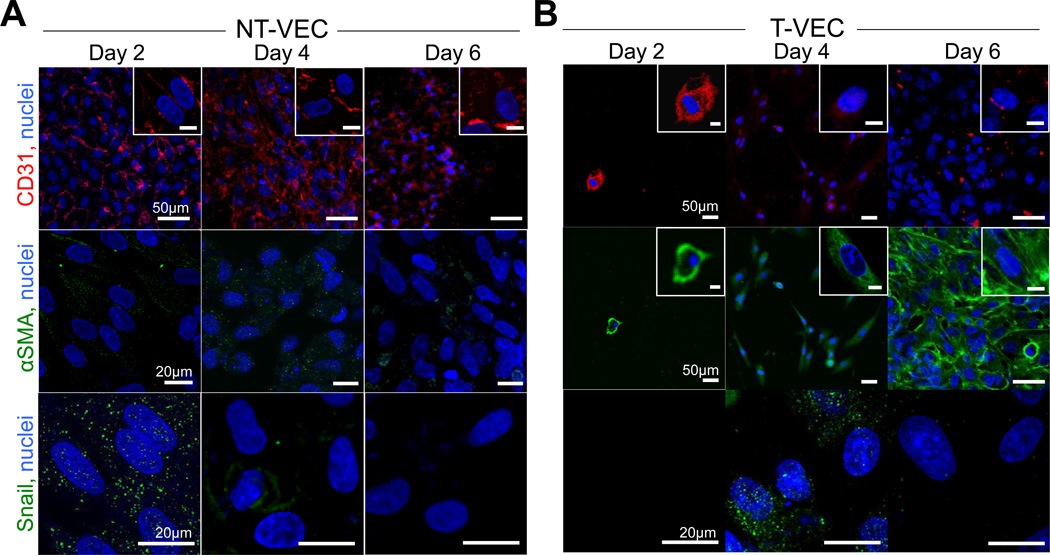
Figure 5.
Expression of EndMT proteins in non-transformed and transformed cells. A. CD31, Snail, and αSMA expression in non-transformed VEC (NT-VEC) after 2, 4, and 6 days of TNFα treatment. B. CD31, Snail, and αSMA expression in transformed VEC (T-VEC) after 2, 4, and 6 days of TNFα treatment. Images are representative of > 3 independent experiments. Scale bar length is indicated in leftmost panel of each row. Scale bar of inset images is 10µm.

