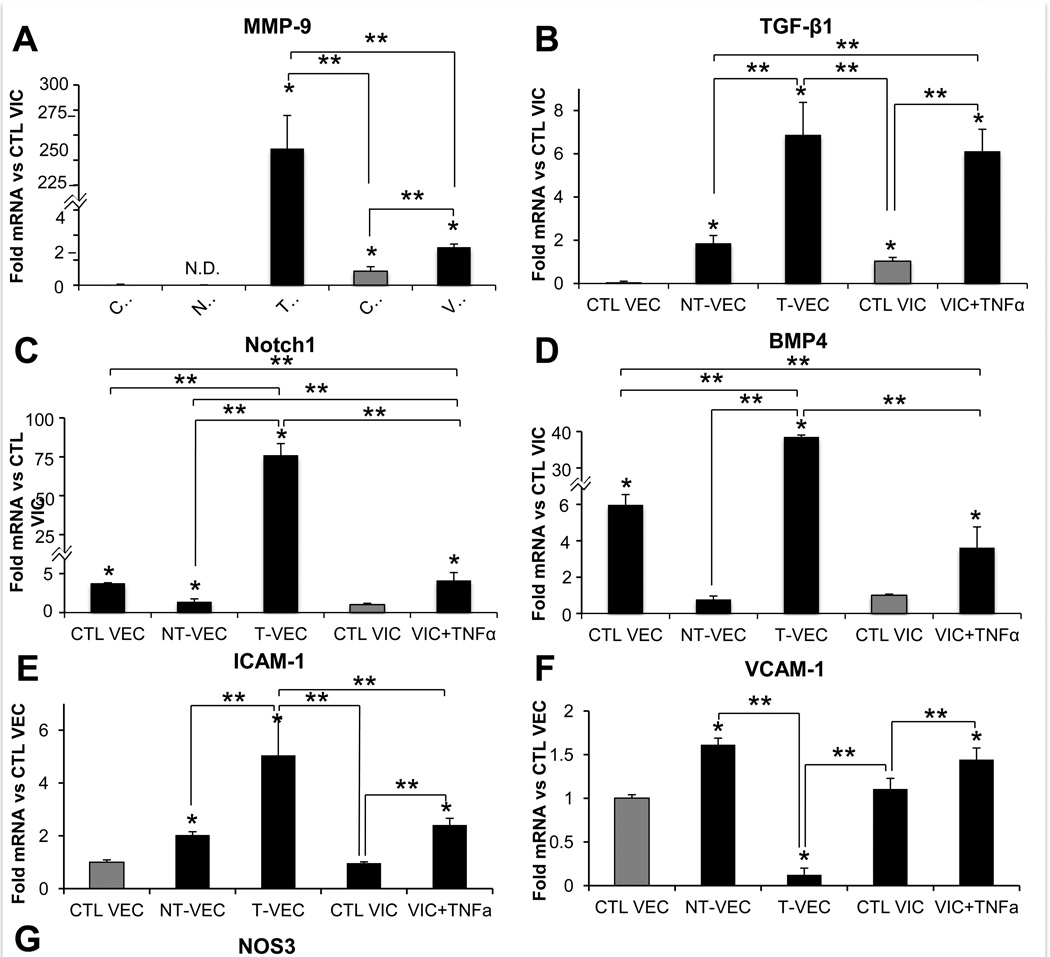
Figure 6.
Comparison of genes related to aortic valve pathogenesis in transformed and nontransformed VEC. A–D. All samples normalized to control VIC, isolated from membrane system or VIC hydrogels after two days of treatment. A. MMP-9 was elevated in T-VEC and VIC+TNFα but not in control VEC or NT-VEC. B. TGF-β1 was elevated in T-VEC and VIC+TNFα, at control levels in NT-VEC and decreased in control VEC, compared to control VIC. C. Notch1 was higher in control VEC, T-VEC, and VIC+TNFα compared to control VIC. NT-VEC had Notch1 levels similar to control VIC. D. BMP4 expression was higher in control VEC, T-VEC, and VIC+TNFα than in control VIC. NT-VEC had BMP4 levels similar to control VIC. E-G. All samples normalized to control VEC, isolated from membrane system or VIC hydrogel after two days of treatment. E. ICAM-1 levels were similar in control VEC and control VIC. NT-VEC, T-VEC, and VIC+TNFα had elevated ICAM-1 levels, with T-VEC having the highest expression. F. VCAM-1 levels were similar in control VEC and control VIC. NT-VEC and VIC+TNFα had elevated VCAM-1 levels and T-VEC had decreased VCAM-1 compared to control VEC. G. NOS3 levels were similar in control VEC and NT-VEC. NOS3 levels were lower in T-VEC, control VIC, and VIC+TNFα compared to control VEC. All experiments performed with n > 3. Errors bars indicate SEM. * indicates p < 0.05 versus control; ** indicates p < 0.05 versus indicated group, according to ANOVA followed by Student’s t-test. VCAM-1 indicates vascular cell adhesion protein 1; ICAM-1, intercellular adhesion molecule 1.

