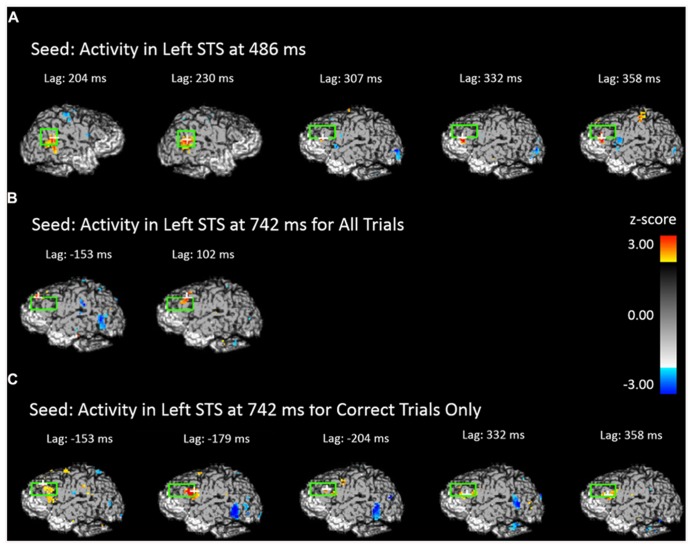
FIGURE 6.
Cross-correlational analyses using the peak activity during the scene preview for the contrast of old scenes > new scenes as the seed resel. The light green rectangle indicates the STS ROI for the first two images and the DLPFC ROI for all others. The white cross marks the peak resel within the ROI. (A) Areas of the brain and time shift that show above-threshold correlation in activity with the peak resel during the scene preview at 486 ms. (B) Areas of the brain and time shift that show above-threshold correlation in activity with the peak resel during the scene preview at 742 ms for all trials. (C) Areas of the brain and time shift that show above-threshold correlation in activity with the peak resel during the scene preview at 742 ms for correct trials only.

