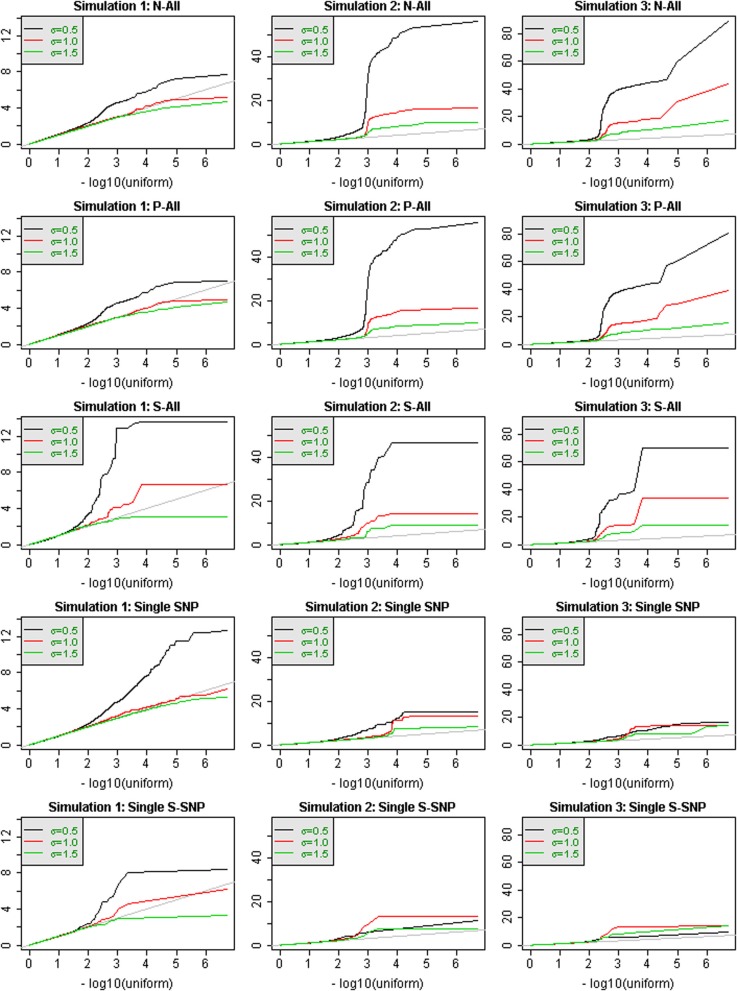
Figure 1.
QQ-plots of p-values for analysis of all chromosome 3 windows, for 3 different simulated phenotypes that were selected to illustrate performance differences. Values of σ are distinguished by color. Region-based testing using three analysis strategies (N-All, P-All, and S-All) are shown in the first three rows. The bottom two rows show the results of single-SNP analyses, either with all SNPS (row 4) or only annotated SNPs (row 5).

