
Figure 3.
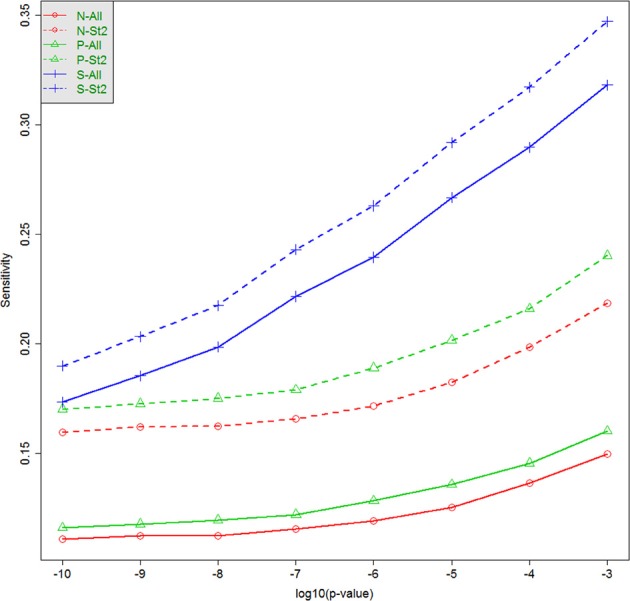
Sensitivity (tSENS) at different significance thresholds (p-values) and for various analytic strategies. The horizontal axis is −log10 (p), and the vertical axis is the true sensitivity for detecting windows containing at least one associated causal variant, when σ = 0.5. N-All: All tests, standard weighting; N-St2: Stratum 2, standard weighting; P-All: All tests, PolyPhen-2 weights; P-St2: Stratum 2, PolyPhen-2 weights; S-All: All tests; subset of damaging variants; S-St2: Stratum 2, subset of damaging variants.