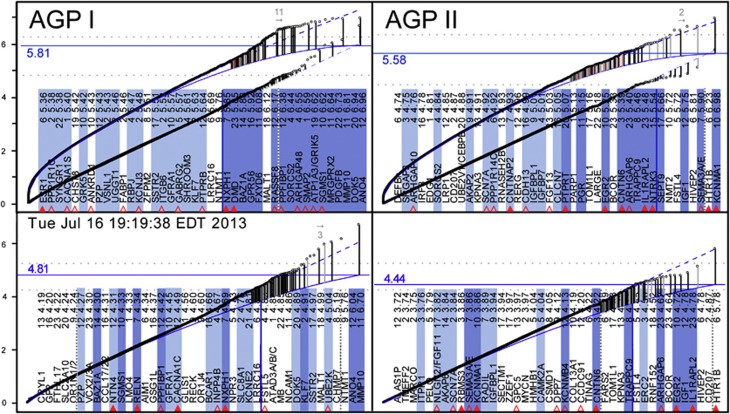
Figure 1.
μGWAS QR plot (curved) vs traditional ssGWAS QQ plot (straight), left: AGP I, right: AGP II. Each point represents the most significant result among all diplotypes centered at the same SNP ranked by significance (low to high). Dashed blue curve: projection. Solid blue curve: loess estimation (see Materials and Methods). Vertical lines connect the most significant s-values (−log10 P) of a gene (dot) with its expected value (solid blue line). Light red and gray vertical lines indicate genes with unknown function and results with low reliability (either low μIC or reliance on a single SNP), respectively. Top and bottom gene list (by significance, right to left, excluding genes with unknown function): μGWAS and ssGWAS results, respectively. Shaded genes are among the genes highlighted in Figure 2. Full and open triangles mark genes with an identical match or family member of SFARI genes, respectively (see Supplementary Table 1 for details). The dotted horizontal lines represent the projected WG apex (6.272 and 6.064) and an exploratory 100 gene cutoff (4.835 and 4.480) for AGP I and AGP II, respectively (Supplementary Table 1). The horizontal solid blue line indicates the proposed study-specific GWS.

