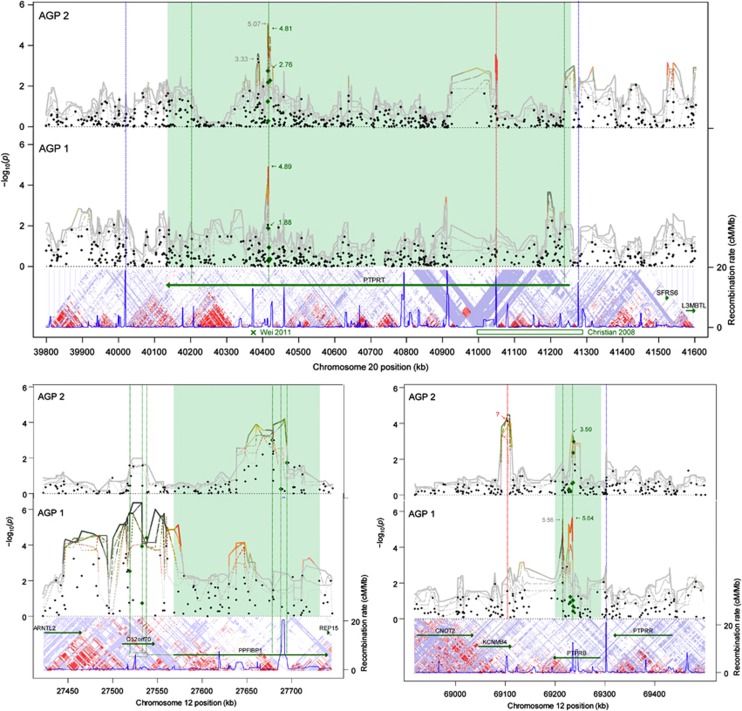
Figure 3.
Extended Manhattan plot of μGWAS results for PTPRT (top), PPFIBP1 (bottom/left), and PTPRB (bottom/right) by AGP stage. The X-axis shows base pairs within chromosome. Black dots indicate significance in ssGWAS, lines indicate significance in diplotypes of width 2 (dotted) .. 6 (solid), red color indicates low μ-scores for reliability, suggesting a potential artifact, unless supported in both populations. Green dots and s-values indicate univariate results for SNPs within the most significant region. s-Values in gray indicate nearby results. Below the panels are gene annotations, LD blocks, and recombination rate from HapMap.81 The PTPRT region comprises rs6102794, rs6072693, rs6072694, rs6102795, rs6016759 and rs6102798. The ‘x' and box at the bottom indicate a somatic mutation at rs14682558474 and a deletion at 41,036,259–41,300,52173 (Supplementary Table S2, AU018704), respectively. The PTPRB: region comprises rs3782377, rs2567137, rs2567133, rs2278342, rs2116209 and rs2278341. KCNMB4 results driven by a single SNP in one population only (rs787931, red ‘x') are indicated as a potential artifact, but the related KCNMA1 was the most significant gene in AGP II (Table 1).

