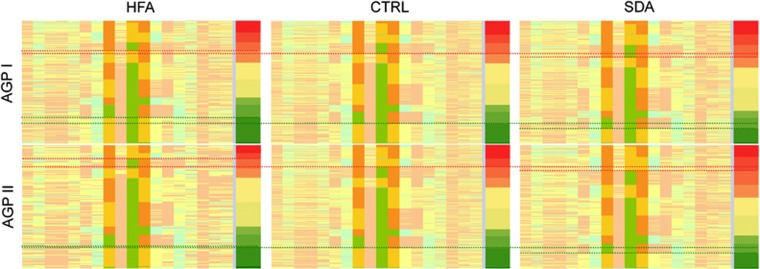
Figure 5.
Comparison of PTPRT allelotype profiles between SDA cases, melanoma controls, and HFA cases. Rows indicating individual subjects' SNP profile (orange/green: homozygous; yellow: heterozygous) are sorted within each population by diplotype μ-score (dark green to dark read) computed from the three consensus SNPs (rs6102794, rs6072694 and rs6102795 out of the six-SNP PTPRT region of Figure 3), which are highlighted as more saturated. Dotted lines are added for visual guidance.

