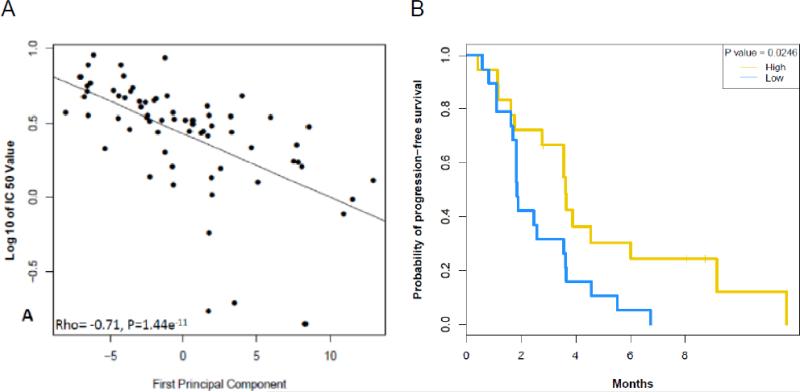
Figure 3.
Sorafenib sensitivity signature: (A) Scatter plot showing the correlation between Sorafenib signature and IC50 of sorafenib (rho = -0.71, P < 0.0001). (B) Kaplan-Meier curve for progression-free survival for the 37 patients with EGFR wild-type tumors and a high vs. low sorafenib sensitivity signature based on the median of the first principal component analysis.

