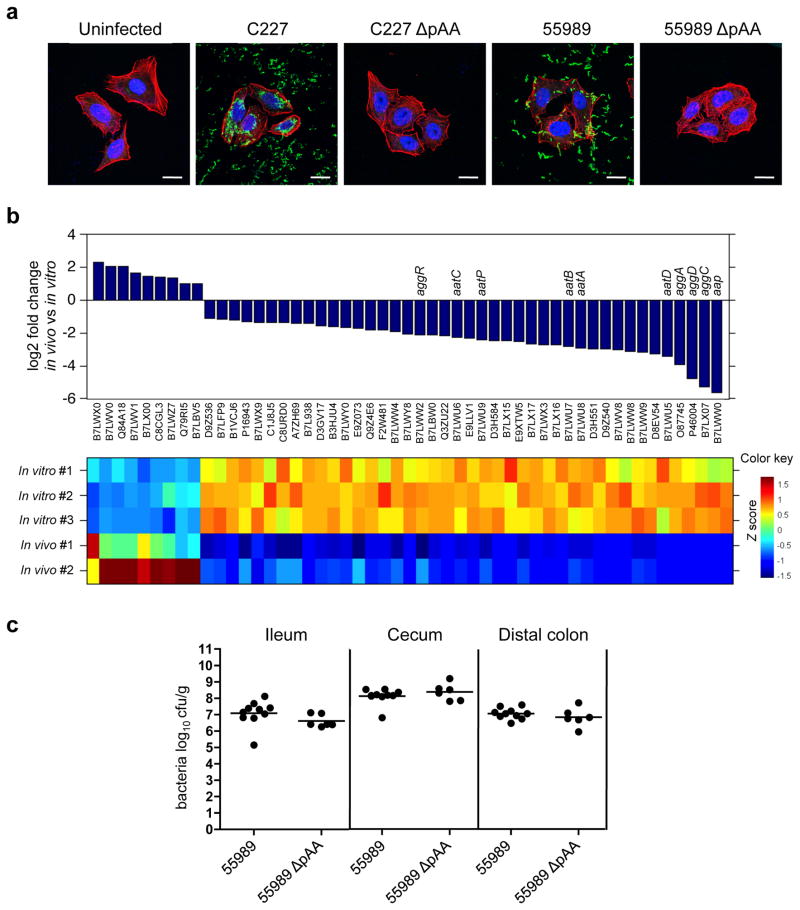
Figure 4. The role of pAA in virulence of O104:H4 EAEC.
(a) Adherence of EAEC to HEp-2 cells. HEp-2 cells infected with the indicated strain were stained with polyclonal antisera against C227 (green) and counterstained with phalloidin-Alexa 568 (red) and DAPI (blue) to detect F-actin and nuclei, respectively. Scale bar=20 μm. (b) Relative expression of pAA genes that are differentially expressed in vivo (rabbit cecal fluid) vs in vitro (LB) at a false discovery rate < 0.01. Graphic and heat map representation of the 51 genes that are differentially expressed in two replicates of C227 in vivo relative to three replicates in vitro. The Z score reflects the degree of decreased (Z score < 0) or increased (Z score >0) abundance, computed by subtracting the mean of the log transformed expression values and dividing by the s.d. for each gene over all sampled scored. (c) Concentration (cfu g−1) of bacteria recovered 2 or 3 days PI from intestinal homogenates of tissues from rabbits infected with the indicated strain. Data points represent individual rabbits (55989, n=10; 55989ΔpAA, n=6). Bars show the geometric mean.

