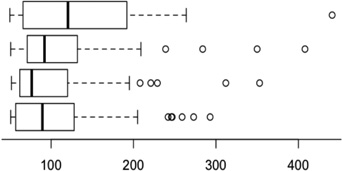
Table 1.
Comparing the clustering methods using functional annotations.
| Method | Boxplots of cluster sizes | # Clusters |
# Genes clustered |
% Clustered genes belonging to same GO slim# |
% Clustered genes belonging to same selected GO terms$ |
|---|---|---|---|---|---|
| Linear average linkage |  |
50 | 4502 | 26.5% | 14.4% |
| MI average linkage | 54 | 4565 | 25.6% | 13.9% | |
| GDHC2 (cluster profile) | 48 | 4585 | 25.7% | 13.8% | |
| GDHC1 average linkage | 42 | 4659 | 28.5% | 15.9% |
Limited to GO slim terms with 2000 or less yeast genes assigned. Percentage between random gene pairs: 22.6%.
Percentage between random gene pairs: 11.0%
