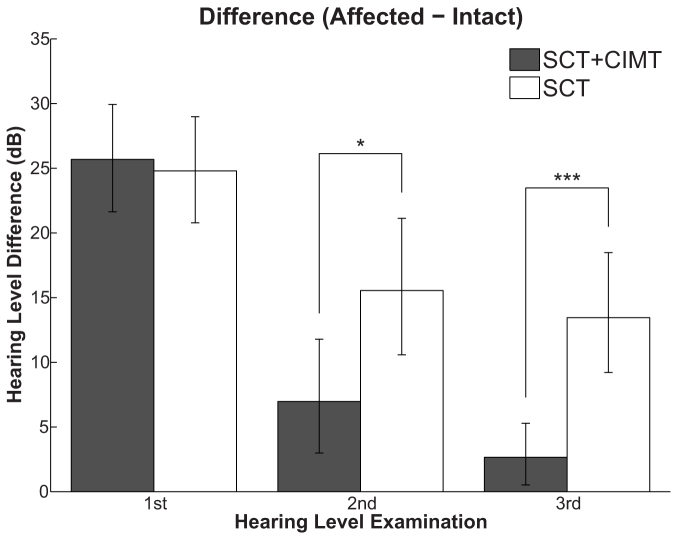
Figure 3. Hearing threshold differences between affected and intact ears averaged across all measured frequencies at the 1st (left: entering hospital), 2nd (centre: leaving hospital), and 3rd (right: first visit as outpatient after discharge) pure tone audiometric examinations.
The bars indicate averages of the standard corticosteroid therapy + constraint-induced sound therapy group (SCT + CIST: gray bars) and the standard corticosteroid therapy alone group (SCT: white bars). The error bars denote the 95% confidence intervals. The asterisks indicate significant differences between groups (Bonferroni-adjusted P values: *P < 0.05; ***P < 0.001).

