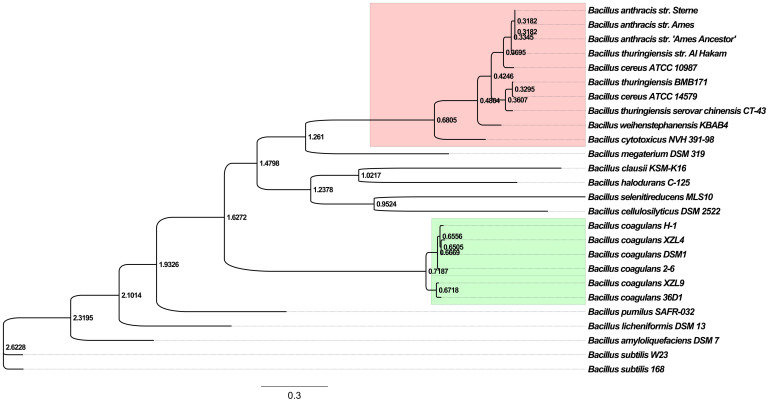
Figure 2. Maximum likelihood tree of Bacillus strains.
Genes that are conserved in all strains were aligned and concatenated for tree construction. The B. coagulans strains are highlighted in green. And strains from B. cereus group are highlighted in pink. A scale bar for the genetic distance is shown at the bottom.

