
Figure 3.
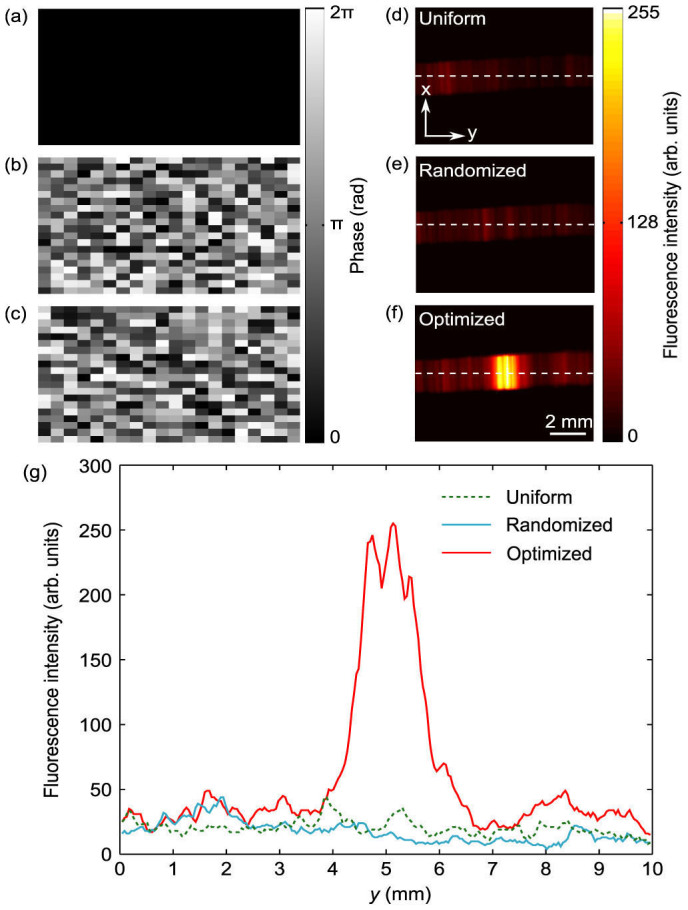
Visualization of the optimized focal spot when uniform, randomized, and optimized phase patterns (a–c) were displayed.The captured CCD images of the fluorescent bar are given in (d–f). The color bars indicate the phase for (a–c) and the CCD intensity for (d–f). (g) The cross sectional intensity, as indicated by the white dotted lines in (d–f). An increase of an order of magnitude is seen using the optimized pattern, compared to both uniform and randomized patterns.