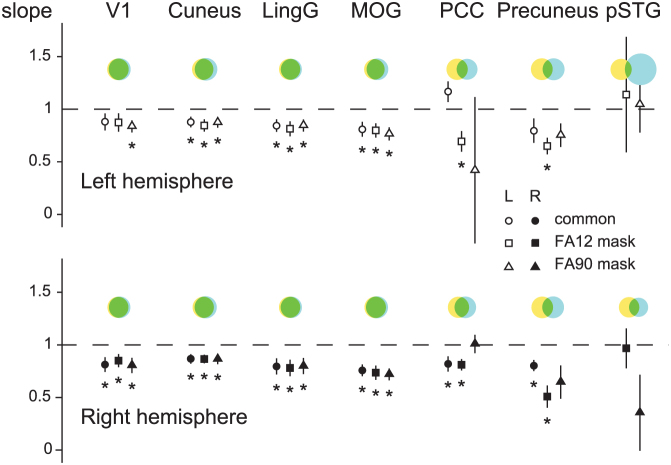
Figure 1. Mean slopes m (across eight subjects, ± SEM) of regression lines βFA90 = m βFA12 + c for each region of interest in the left (top) and right (bottom) hemispheres.
Slopes were calculated for significantly-activated voxels common to both FA12 and FA90 (circles), significantly-activated voxels extracted using the FA12 activation map (squares), and significantly-activated voxels extracted using the FA90 activation map (triangles). Slopes statistically significantly (asterisks; two-tailed t-tests, p < 0.05) different from 1 (dashed horizontal line) indicate FA-dependent activation strengths. The colored Venn diagrams indicate the proportions of significantly activated voxels for FA12 (yellow), FA90 (blue), and voxels significantly activated at both FAs (green). The wide error range in left PCC for the FA90 mask is due to one subject for whom only 5 data points were available, with m = −4; without that subject m would be 1.14 ± 0.24.

