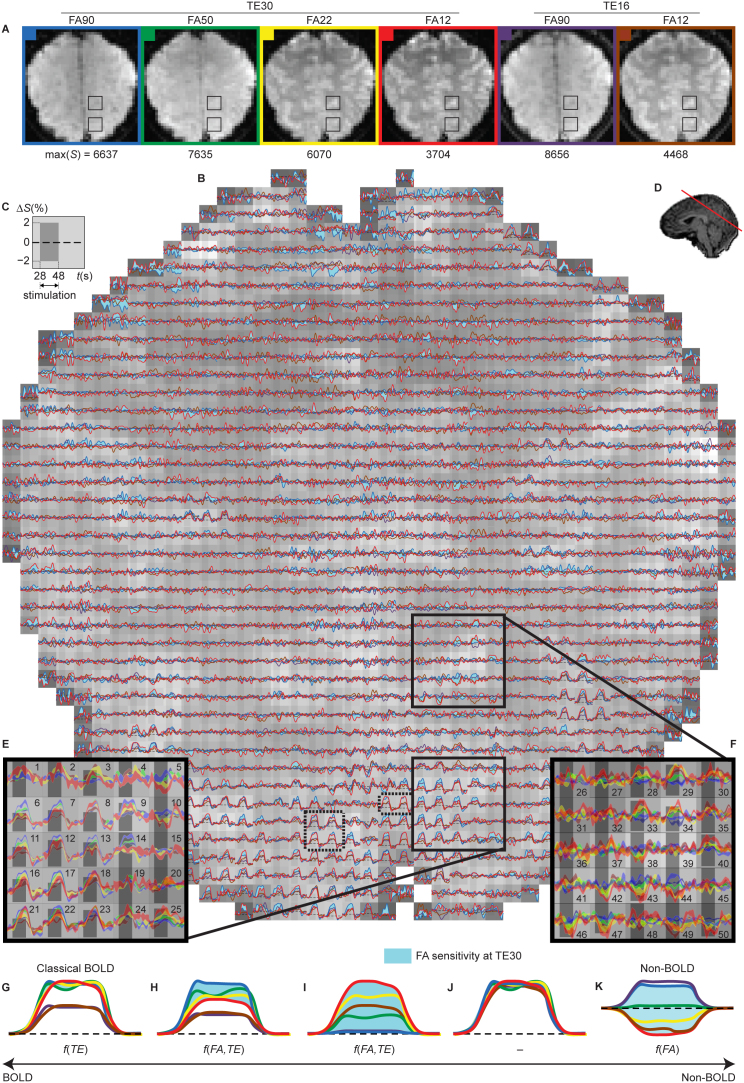
Figure 4. Anatomical and time-series results in subject S4.
(A) The anatomical tissue contrast and signal level max(S) of an oblique slice (D) imaged with six different FA/TE combinations as indicated. The signal (%ΔS) time courses (B) correspond to the different APs (color-coded as in (A) and overlaid on the 1343 voxels of the FA12/TE30 baseline image (red square in (A)). The stimulation period and the amplitude scaling (C) are shown for each voxel separately. The insets (E) and (F) enclose two areas whose voxels exhibit a wide range of responses (with cartoon schematics in (G–K)), ranging from classical BOLD to non-BOLD. The bands in (E) and (F) represent mean ± SEM values.

