
Figure 6. Stimulation.
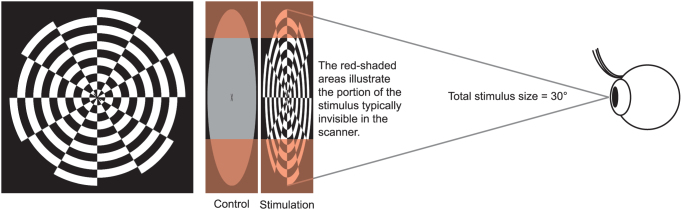
The visual stimulus consisted of a circular checkerboard (left) with the checks switching between black and white at a rate of 8 Hz. During the control condition, the subjects viewed a grey circle. The total eccentricity of the stimulus was 15°, but the scanner setup limited the view to a smaller portion, as illustrated by the red-shaded boundaries. Due to differences in head size and shape, each subject viewed a slightly different portion of the scene.