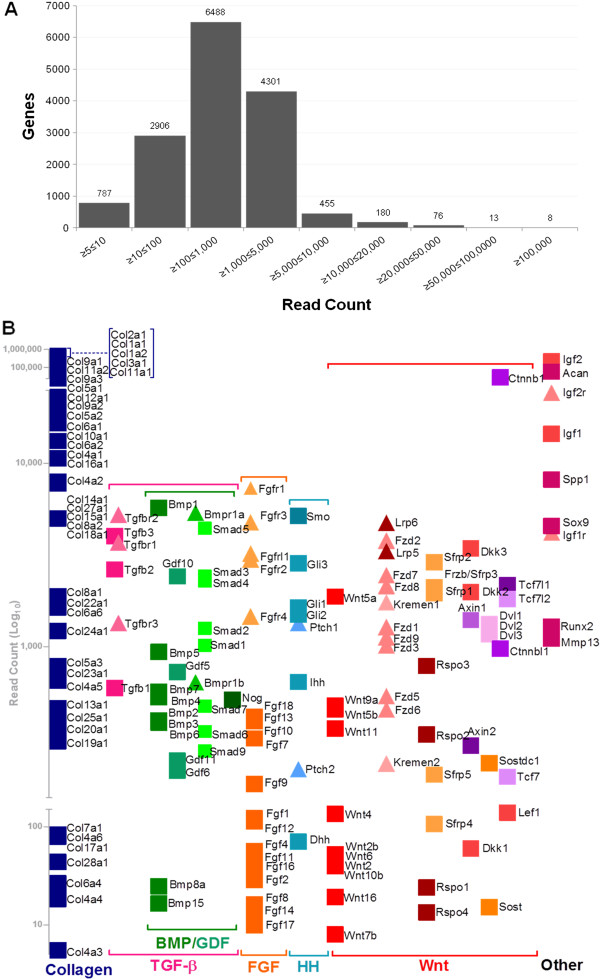
Figure 2.
Transcriptome Profiling of the developing humerus at TS23 by RNA-seq, (A) The number of genes (y-axis) with increasing relative expression levels represented by transcript read counts as indicated. (B) The relative expression of selected genes represented by read counts (Log10) (y-axis). Collagen genes and signalling pathways genes are grouped: TGFβ (including TGFβ, BMP and GDF ligands, receptors and agonists), FGF (ligands and receptors), HH (ligands, receptors and intracellular modulators), Wnt (Wnt ligands and agonists (Wnt, Rspo), receptors (Fzd) and co-receptors (Kremen, Lrp), antagonists (Sfrp, Dkk) Intracellular components (Sost, Dvl, Ctnnb) and nuclear components (Tcf, Lef)) and a selection of ‘other’ genes associated with skeletal development. Squares indicate ligands and modulators, triangles indicate receptors.

