Figure 3.

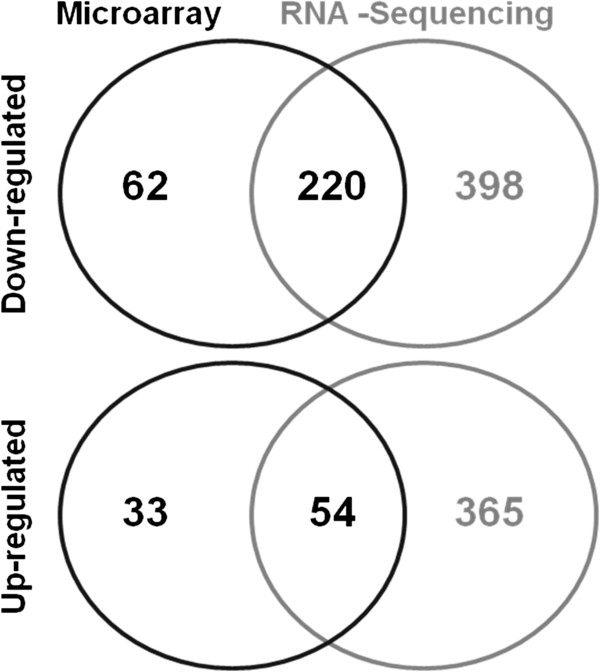
Venn diagrams representing the overlap of independent genes detected as differentially expressed (up-regulated and down-regulated; cut off criteria p ≤ 0.05, and fold change ≥2) from the microarray and RNA seq analysis, as indicated.

Venn diagrams representing the overlap of independent genes detected as differentially expressed (up-regulated and down-regulated; cut off criteria p ≤ 0.05, and fold change ≥2) from the microarray and RNA seq analysis, as indicated.