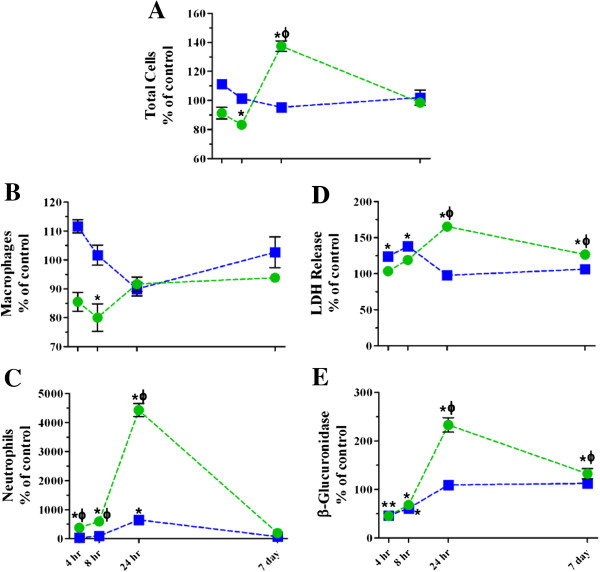
Figure 2.
Time course of changes in BALF cellular and biochemical parameters following single high dose exposure to TiO2 NPs. The numbers of cells (A), macrophages (B), and neutrophils (C), and LDH (D) and β-glucuronidase activities (E) were assessed 4, 8, 24 hr and 7 days post inhalation (blue squares) or instillation (green circles) exposure. Values are group means ± SE (n = 5) and are represented as a percentage of respective controls. *, significantly different from corresponding controls; Φ, significantly different between exposure methods (p < 0.05).

