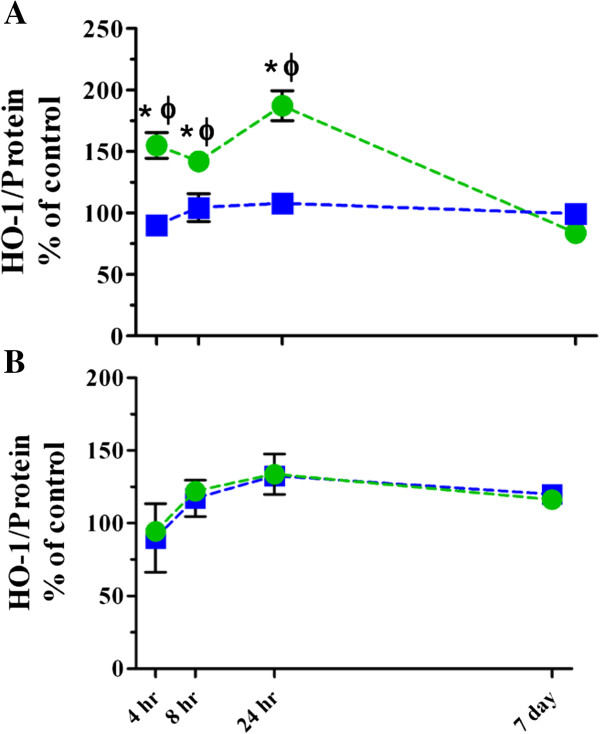
Figure 5.
HO-1 levels in lung homogenates and BALF cell pellets following single high dose exposure to TiO2 NPs. HO-1 levels in lung homogenates (A) and BALF cell pellets (B) following inhalation (blue squares) or instillation (green circles) exposure. Values are group means ± SE (n = 5) and represented as percentage of controls. *, significantly different from corresponding controls; Φ, significantly different between exposure methods (p < 0.05).

