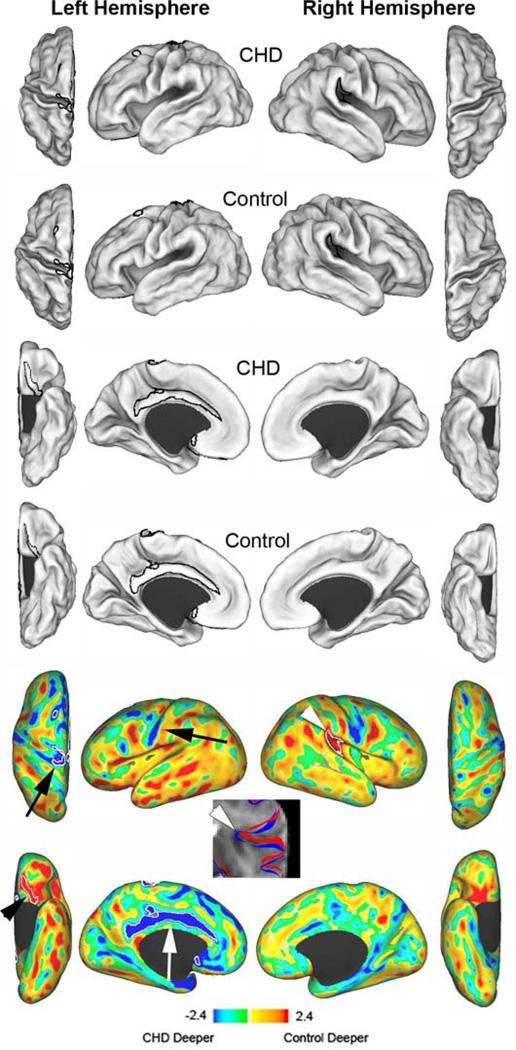
Figure 2.
Cortical mid-thickness surface reconstructions and sulcal depth variations. The first two rows represent mean surface reconstructions for dorsal and lateral surfaces of CHD infants (first row) and term control infants (second row). The third (CHD infants) and fourth (control infants) rows represent the mean surface reconstructions for the ventral and medial surfaces. T maps (bottom two rows) represent the differences between the mean surfaces. Areas in yellow and red indicate regions where control infants were deeper; blue and green indicate regions where infants with CHD were deeper (or controls had broader gyri). White contours outline statistically significant differences between the two groups at p<0.025. The black arrowhead identifies the orbitofrontal region, the white arrow identifies the cingulate gyrus, the black arrows identify the central sulcus, and the white arrowhead identifies the superior ascending limb of the lateral sulcus. The T2-weighted image identifies the contours of the lateral sulcus in the right hemisphere for CHD infants (red) and control infants (blue). The CHD infants display reduced sulcation with a more open sulcus.

