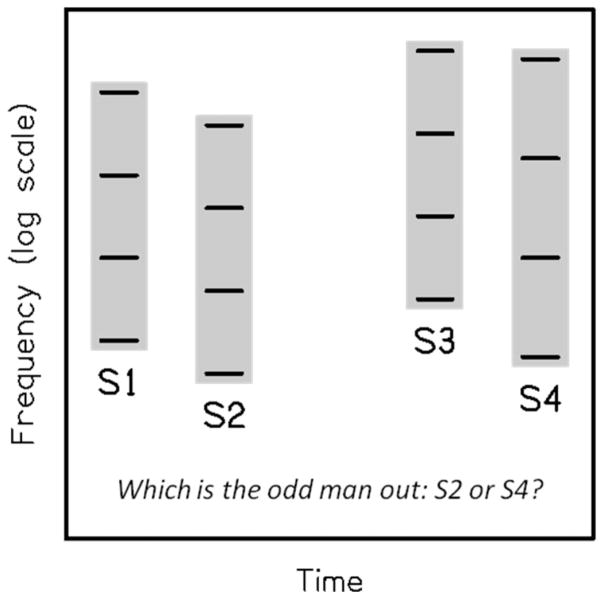
Figure 1.
Schematic representation of listeners’ task in the “simultaneous” condition of Experiment 1. On each trial, four stimuli (S1, S2, S3, S4) were successively presented (their relative timing is not faithfully depicted in this Figure). Each stimulus consisted of four synchronous pure tones, equally spaced on a logarithmic frequency scale. The spacing of the tones was the same (namely, 0.97 octave) for three stimuli, and was larger for the remaining stimulus, which was either S2 or S4. Listeners had to identify the odd man out as S2 or S4. The frequency of the lowest component of each stimulus was randomly chosen between 125 and 250 Hz. The “sequential” condition of Experiment 1 was similar, except that in this case the four components of each stimulus were presented consecutively.

