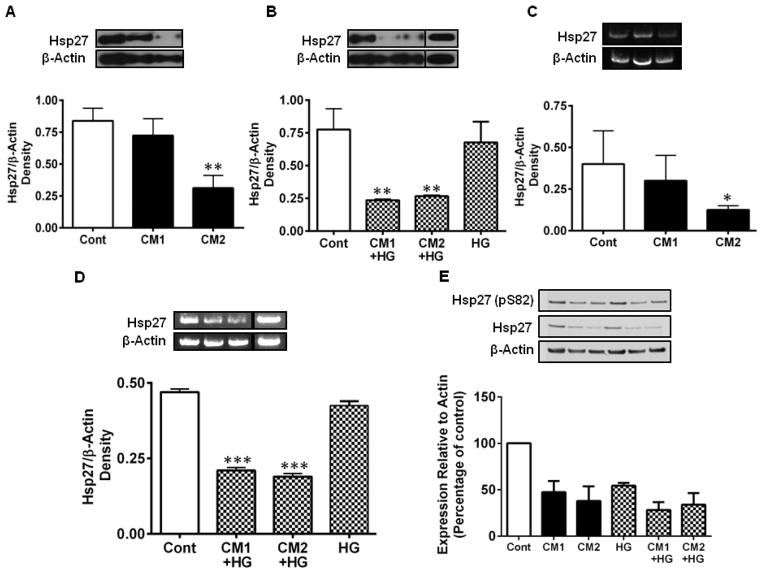
Figure 2. CM and HG downregulate Hsp27 in HREC.
HREC cultures were incubated with cytokine mixtures, CM1=10 ng/mL TNF-α, 10 ng/mL IL-1β and 50 units/mL IFN-γ or CM2 = 20 ng/mL TNF-α, 20 ng/mL IL-1β and 100 units/mL of IFN-γ for 48 h. Hsp27 was measured by Western blotting and densitometry. CM downregulated Hsp27 protein (A) and mRNA (C) and in the presence of high glucose (HG, 25 mM glucose) further downregulated both Hsp27 protein (B) and mRNA levels (D). HG alone showed a slightly lower but statistically insignificant reduction. Hsp27 phosphorylation at S82, assessed by Western blotting was also reduced by CM ± HG (E). In all figures, representative Western blots/gels are shown at the top left. β-actin was used as the loading/internal control. The bars represent means ± SD of three independent experiments, but in the case of pHsp27 they represent mean values of two independent experiments. * p < 0.05, ** p < 0.005 and *** p < 0.0005, versus control. Cont =Control.

