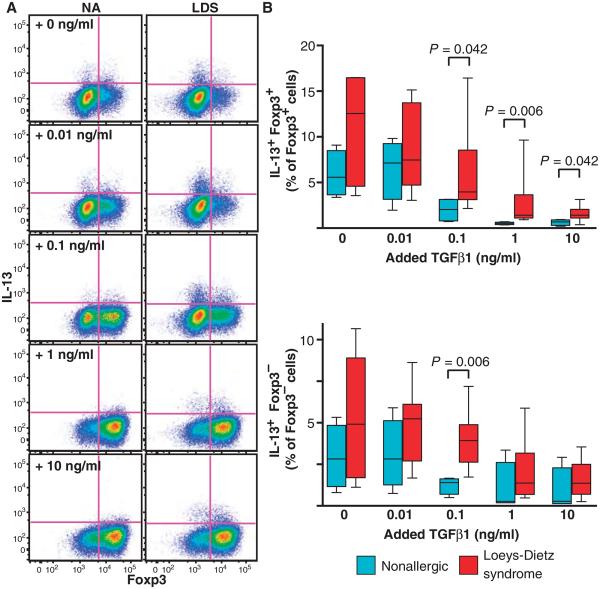
Fig. 5. Skewing potential of naïve CD4+ lymphocytes from LDS subjects and nonallergic controls after TGFβ stimulation.
(A) Representative dot plot depicting expression of Foxp3 and IL-13 in LDS (n = 7) and nonallergic (NA; n = 4) CD4+ lymphocytes 4 days after naïve CD4+ T cells were cultured with increasing doses of recombinant TGFβ1 as indicated. (B) Percentage of IL-13–expressing Foxp3+ and Foxp3− cells in cultures from LDS patients (n = 7) compared to nonallergic controls (n = 4) after treatment with the indicated doses of recombinant TGFβ1. Significant P values are indicated; comparisons by Mann-Whitney test.

