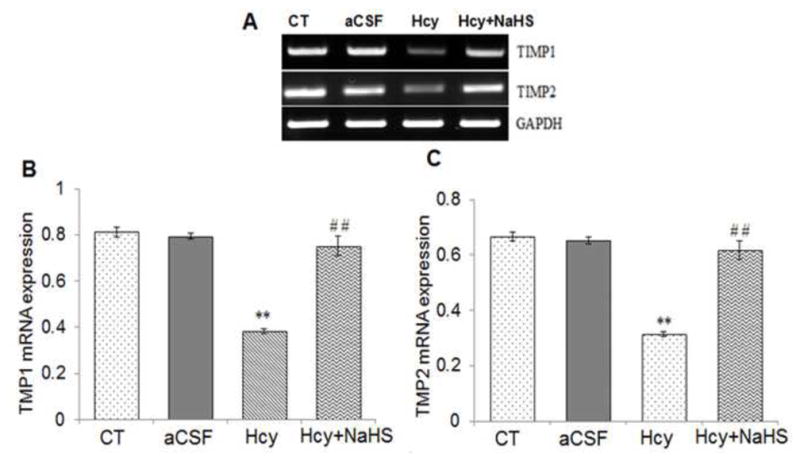
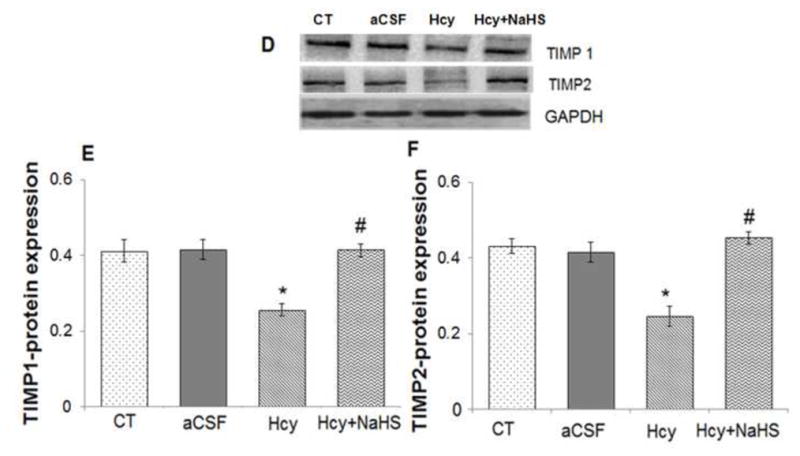
Fig. 11. Effect of NaHS on TIMPs.


(A) RT-PCR analysis of TIMP-1: [F(3, 16)=1.45; P< 0.005] and TIMP-2 mRNA expression: [F(3, 16)=.63; P< 0.01] in WT, WT+aCSF, WT+Hcy and Hcy-treated WT+NaHS mouse brain. The GAPDH was using as loading control (B&C) Densitometry analysis of TIMP-1/TIMP-2 mRNA expressions as represented in the bar diagram. Data represents mean ±SE from n = 5 per group. **P< 0.005 vs Control group and ##P< 0.001 vs Hcy treated group.
(D) Western blot analysis of TIMP-1: [F(3, 16)=.34; P< 0.001] and TIMP-2: [F(3, 16)=.55; P< 0.05] protein expression in mouse brain. The GAPDH was using as loading control (E & F) Densitometry analysis of TIMP-1/TIMP-2 protein expressions as represented in the bar diagram. Data represents mean ±SE from n = 5 per group. **P< 0.005 vs Control group and #P< 0.01, ##P< 0.001 vs Hcy treated group.
