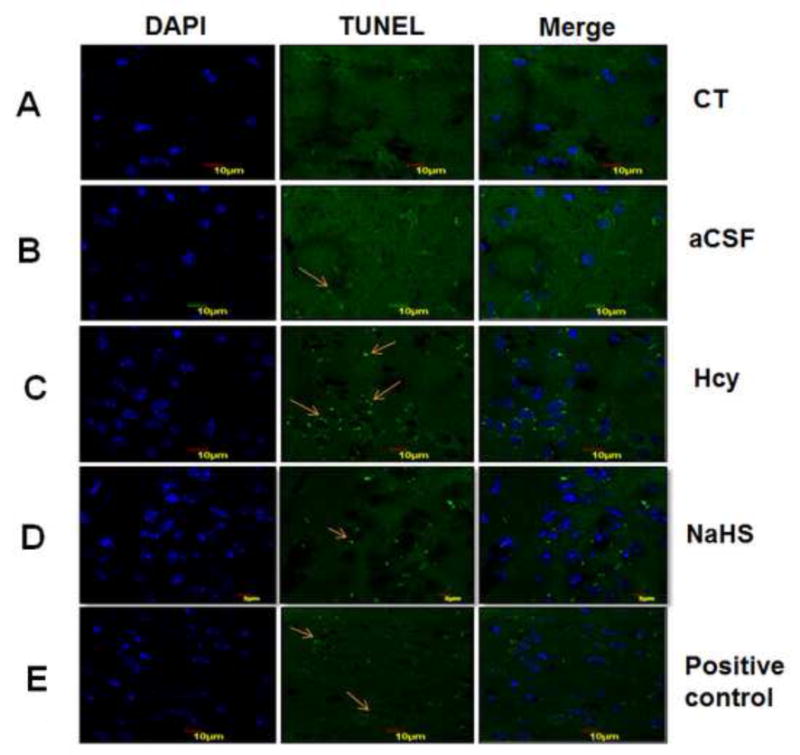
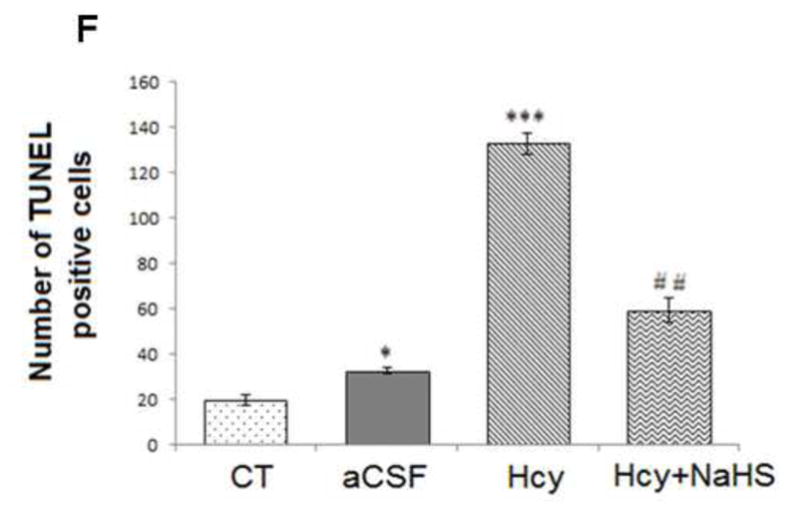
Fig. 8. Tunnel assay for apoptosis in WT, WT+aCSF, WT+Hcy and Hcy-treated WT+NaHS groups.


Apoptotic cells are seen as green fluorescent dots (scale bar- 10 μm). No difference observed in apoptotic cells of control (A) and CSF (B) group. Apoptotic cell death was increased in Hcy treated brain (C). NaHS treament decreased the apoptotic cell (D). Positive control also represented in this image (E). Bar graph representing a significance of difference between different treatment groups (F). Data represents mean ±SE from n = 5 per group; *P< 0.05, **P< 0.005 vs Control group and #P< 0.05, ##P< 0.001 vs Hcy treated group. Note: Arrow is showing apoptotic cells.
