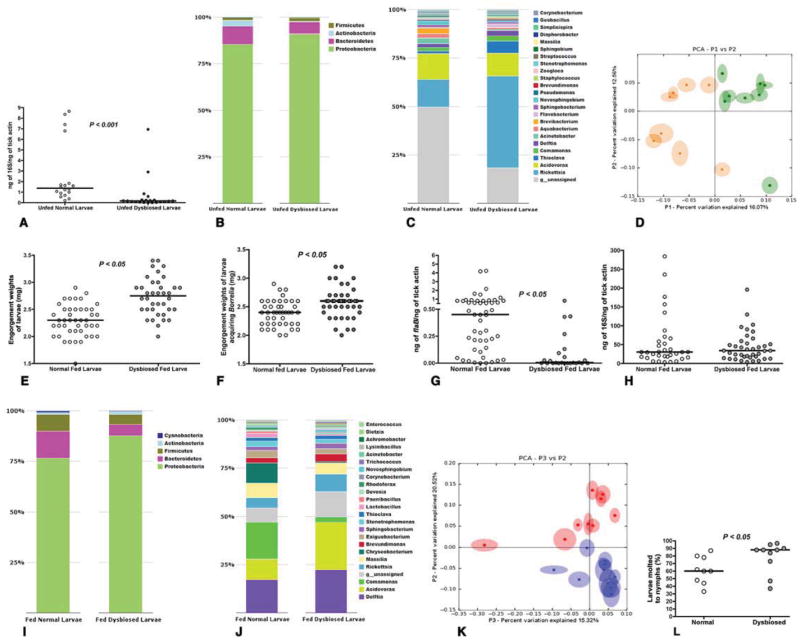
Figure 1. Dysbiosis alters larval feeding, and molting efficiency.
A. Quantitative PCR (QPCR) of 16S rDNA in Unfed normal and unfed dysbiosed larvae. B. Phylum; and C. Genera level composition of unfed normal and dysbiosed larvae; D. Principal Coordinate Analysis of unweighted jack-knifed UniFrac distances of microbial communities from unfed normal (green) and unfed dysbiosed larvae (yellow). E. Engorgement weights of normal and dysbiosed larvae fed on clean C3H mice. F. Engorgement weights of normal and dysbiosed larvae fed on B. burgdorferi-infected C3H mice. G. QPCR analysis of B. burgdorferi burden in normal and dysbiosed larvae fed on B. burgdorferi-infected C3H mice. H. QPCR of 16S rDNA in fed normal and dysbiosed larvae. I. Phylum, and J. Genera level composition of fed normal and dysbiosed larvae. K. Principal Coordinate Analysis of unweighted jack-knifed UniFrac distances of microbial communities from fed normal (blue) and fed dysbiosed larvae (red). L. Molting efficiency of engorged normal and dysbiosed larvae assessed 8 weeks post feeding. Each data point represents a percentage of 50 larvae/tube. Each data point in A, D, and K represents ~ 20 larvae and E, F, G, and H represents pools of 5 larvae. Horizontal bars represent the median, and mean values significantly different in a two-tailed non-parametric Mann-Whitney test (P < 0.05) indicated. In B, C, I, and J all detectable components at the phylum level are shown, and up to 23 dominant components (> 0.05 %) at the family level are shown. See also Fig S1.

