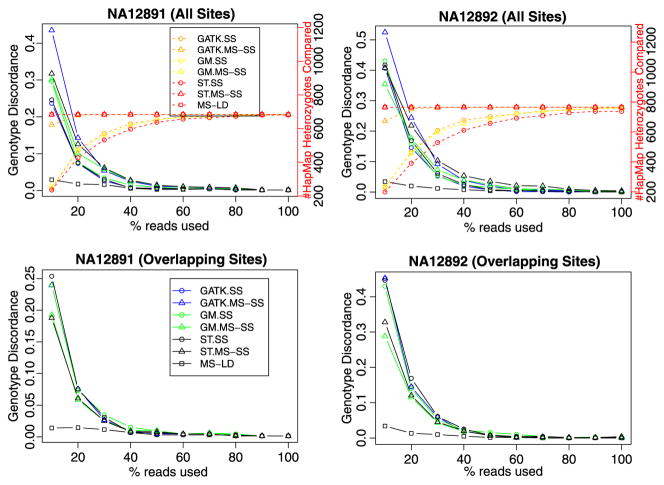
Fig. 3.
Comparison of methods on high coverage data from the 1000 genomes pilot project. Three classes of methods, namely SS, MS-SS, and MS-LD, are compared in terms of both number of heterozygotes detected and genotype concordance with experimental genotypes (from the International HapMap project) at detected sites, for NA12891 and NA12892 who were sequenced to a high coverage (average depth ~40X) in the 1000 Genomes Pilot Project. The right Y -axis shows the number of sites where the method generates a genotype call and where the experimental genotype is heterozygous. Warm color (red, yellow and orange) dotted lines and points use this axis. The left Y -axis shows the genotype discordance rate at the compared heterozygotes. Cool color (blue, green and black) solid lines and points use this axis. For both SS and MS-SS, three methods are used: GATK (GATK UnifiedGenotyper), GM (glfMultiples), and ST (samtools). For clarity, the right-Y axis legend is only shown in NA12891 (all sites) and the left-Y axis legend only shown in NA12891 (overlapping sites). (Color figure online)

